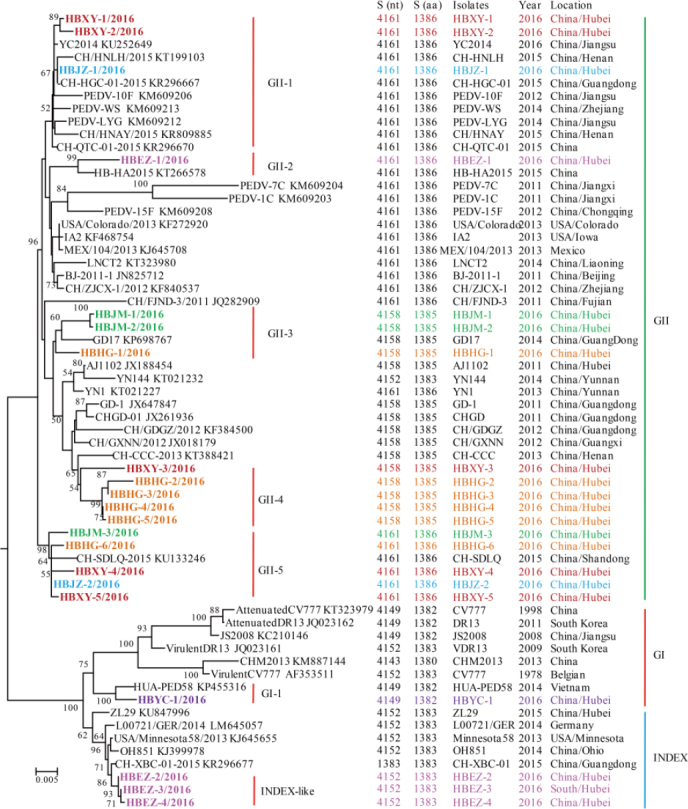
Figure 2.

Phylogenetic analysis of full-length amino acid sequences of spike proteins of PEDV. The phylogenetic tree was constructed based on the maximum likelihood method using a Poisson model under 1000 replicates of bootstrap values; for each node, bootstraps ≥ 50% are shown. The scale bar represents 0.005 substitutions per amino acid. The strain names, isolation years and places, and GenBank accession numbers are shown. S (nt) and S (aa) indicate the complete length of the nucleotide and amino acid sequences of the S genes and S proteins, respectively. The results for the GI, GII, and INDEX-like genogroups were in accordance with previous studies; subgroups shown in the figure were proposed in this study for better description of the genetic diversity of spike proteins. Spike sequences detected in this study are colored and in bold.
