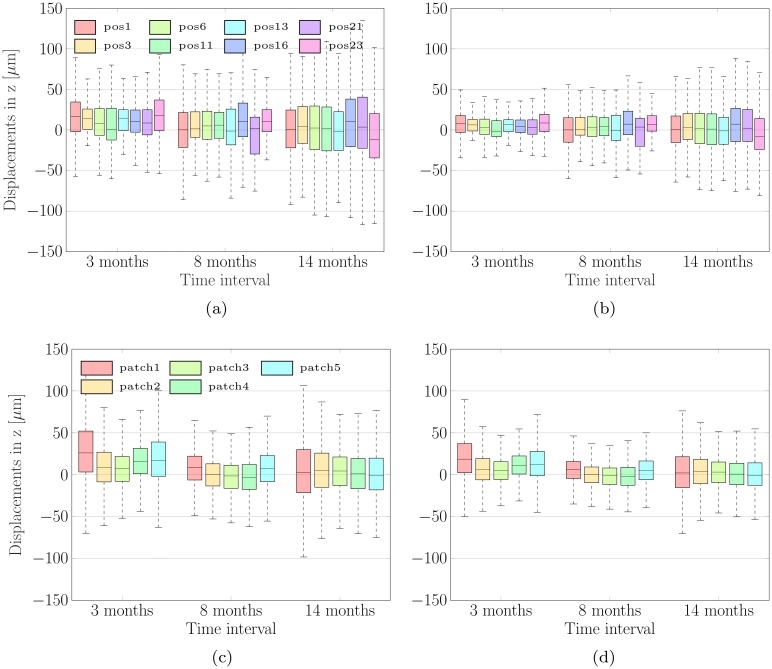
Fig 9. The average displacements of the CSI grouped by time intervals.
Above: The average displacements of the CSI detected by the expert group (a) and by CRAR (b) grouped by time intervals between the two measurements and subdivided into eight scan positions. Below: The average displacements of the CSI detected by the expert group (c) and by CRAR (d) grouped by time interval and subdivided in nasal-temporal/x-direction into five equidistant regions C-B-A-B-C (patches) symmetrically distributed around the foveal center, see Fig 6.

