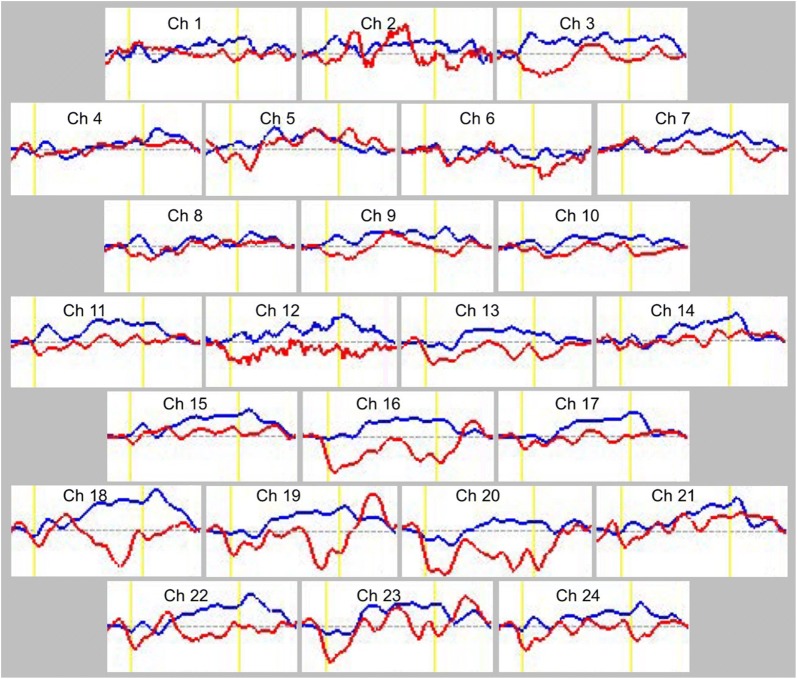
Fig. 2.
Grand average waveforms of oxyhemoglobin (oxy-Hb) concentration changes during the Stroop color-word task in both groups. The red lines are the grand average waveforms of oxy-Hb in the autism spectrum disorder (ASD) group, and the blue lines are the grand average waveforms of oxy-Hb in the control group. The activation task was performed in the time period between the yellow lines

