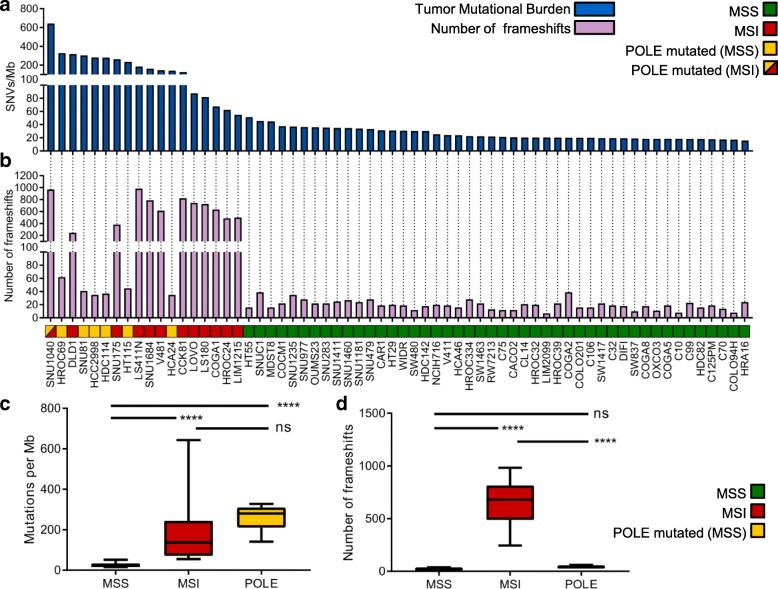
Fig. 1.
Analysis of mutational burden in a panel of 64 CRC cell lines. Mutational characterization and comparison of SNVs and frameshifts among MSS (46 samples), MSI (12 samples), and POLE mutated (6 samples) of CRC models. a The distribution of SNVs per Mb of coding DNA at time 0 is shown for each cell line. b The number of frameshift mutations at time 0 is shown for each cell line. c The number of SNVs per each group is shown (“MSS” refers to MSS cells without POLE mutations; “MSI” includes MSI cells, as well as the SNU1040 cell line which is both MSI and POLE mutated; “POLE” includes only MSS cell lines carrying a POLE mutation). d The number of frameshifts per group is shown. The center line of each box plot indicates the median. p < 0.0001

