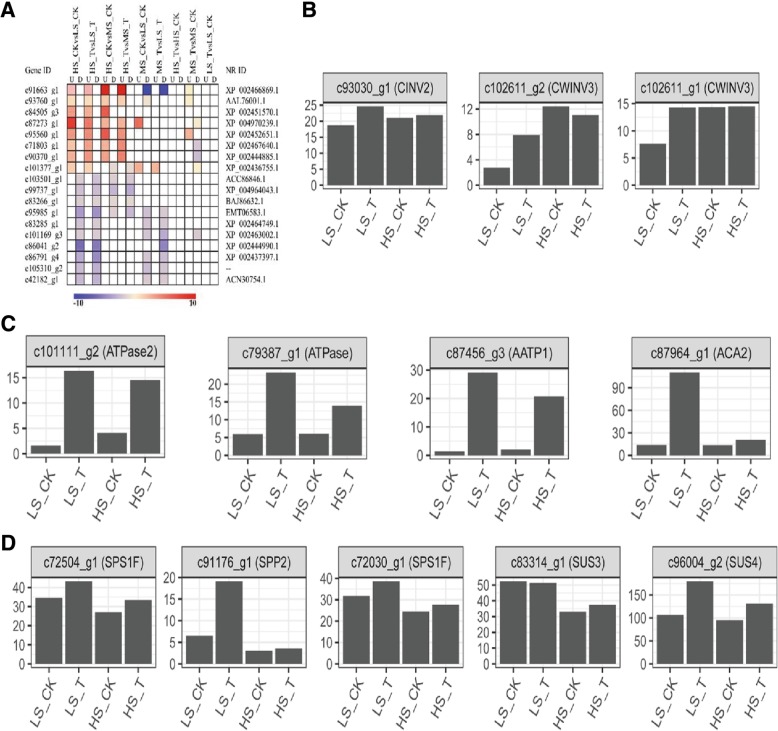
Fig. 4.
Analysis of differential expression of unigenes associated with carbohydrate metabolism. Pairwise comparison of differentially expressed unigenes involved in starch and sucrose metabolism (a). The significance in each comparison pair is indicated using log-transformed P-value (red); the dark gray areas represent missing values. Expression of invertases (b), ATPase (c) and SPS/SUS in HS and LS (d) as affected by ethylene treatment. CK- check (water control), T- ethephon treatment, HS: high-sugar variety, MS: medium-sugar variety, LS: low-sugar variety

