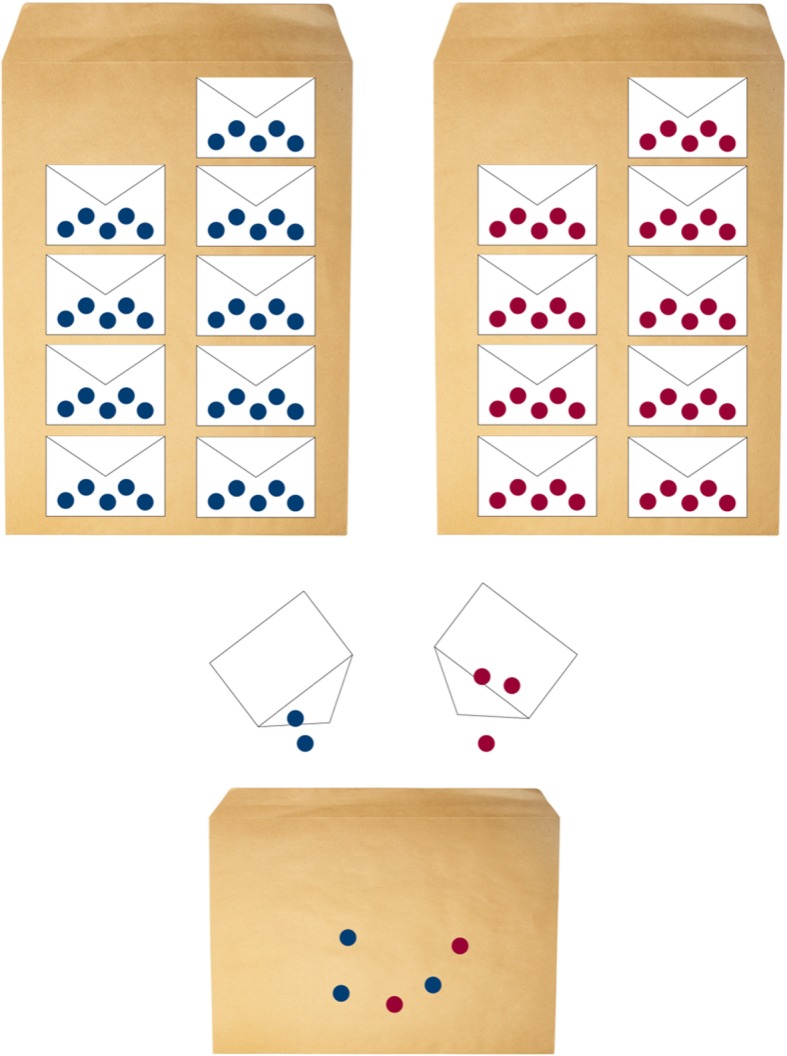
Fig. 2.

Illustration of the randomisation process regarding intervention groups, e.g. treatment arm 1 and 2. Each dot represents a sealed, opaque envelope that contains a note with the treatment arm allocation. The blue and red dots represent “conservative” and “operative” treatment, respectively. Whenever only 3 envelopes are left, 5 new “operative” and 5 new “conservative” treatment envelopes are mixed and added
