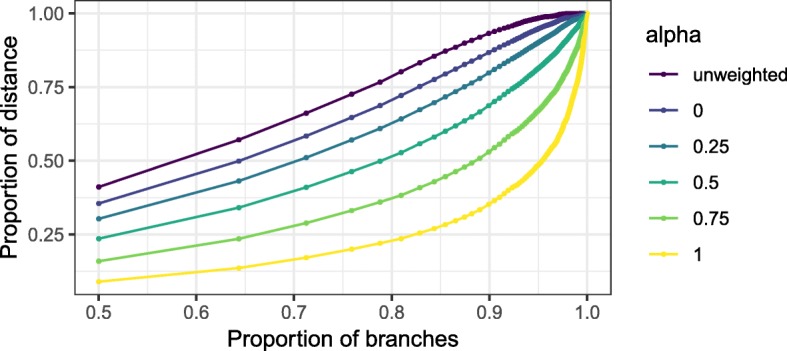
Fig. 1.

Cumulative average contribution (vertical axis) of the shallowest p fraction of the branches in the tree (horizontal axis) to unweighted and generalized Unifrac distances in the antibiotic data. A very large proportion of the unweighted Unifrac distance is contributed by branches with only a few descendants, while that proportion is much smaller for weighted Unifrac
