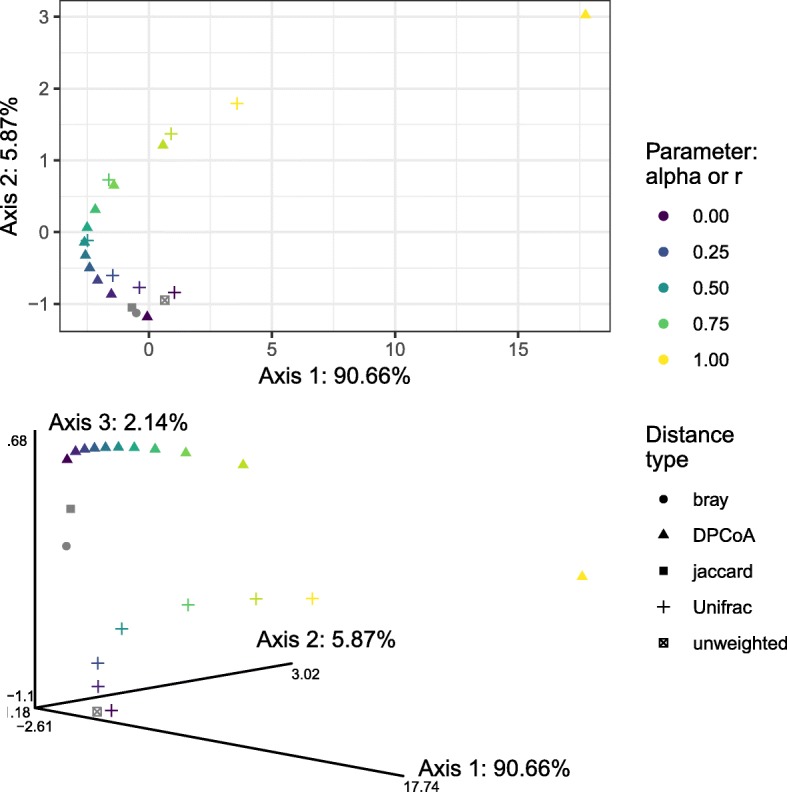
Fig. 7.

DISTATIS representation of the relationships between the generalized Unifrac distances, generalized DPCoA distances, unweighted Unifrac distance, Bray-Curtis dissimilarity, and Jaccard dissimilarity, as computed on the illustrative dataset. Top panel represents the distances on the first two principal axes, bottom panel represents the distances on the top three principal axes
