Fig. 3.
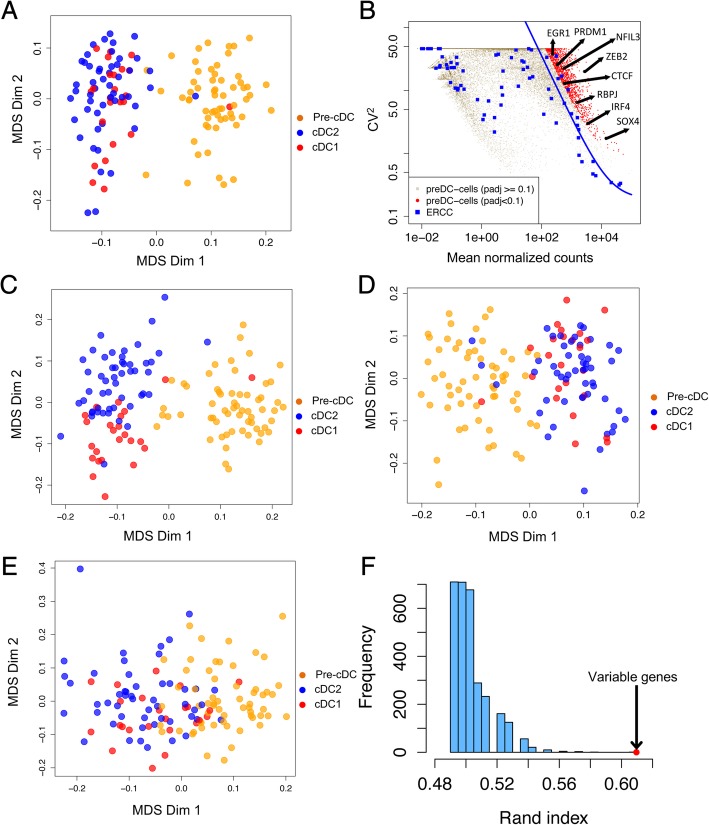
Highly variable genes in pre-cDCs population can separate DC subsets. a MDS plot of all the single cells based on global transcriptome. b Squared coefficient of variation (CV2) was plotted against the mean of normalized read counts for each gene of 50 pre-cDCs in Batch 2. The solid blue curve denotes the fitted variance-mean dependence with ERCC spike-ins. The genes marked in red show higher expression variability than background/technical noise (measured with spike-ins, blue) by testing the null hypothesis that the coefficient of biological variation is less than 50% with FDR < 0.1. c MDS plot of all the single cells with the 842 biologically variable genes. d MDS plot of all the single cells with randomly 842 sampled genes without replacement from genes that have mean expression > 100 in panel A. e MDS plot of all the single cells with 496 cell cycle genes downloaded from Reactome (http://www.reactome.org). f Histogram of rand index between the clustering result based on 842 sampled genes and the inferred cDC identities in Fig. 2. Larger rand index indicates higher consistence between two clustering results. Genes of high expression were randomly selected for 3000 rounds. The red dot indicates the rand index between the DC clusters based on the 842 variable genes and the inferred cDC identities

