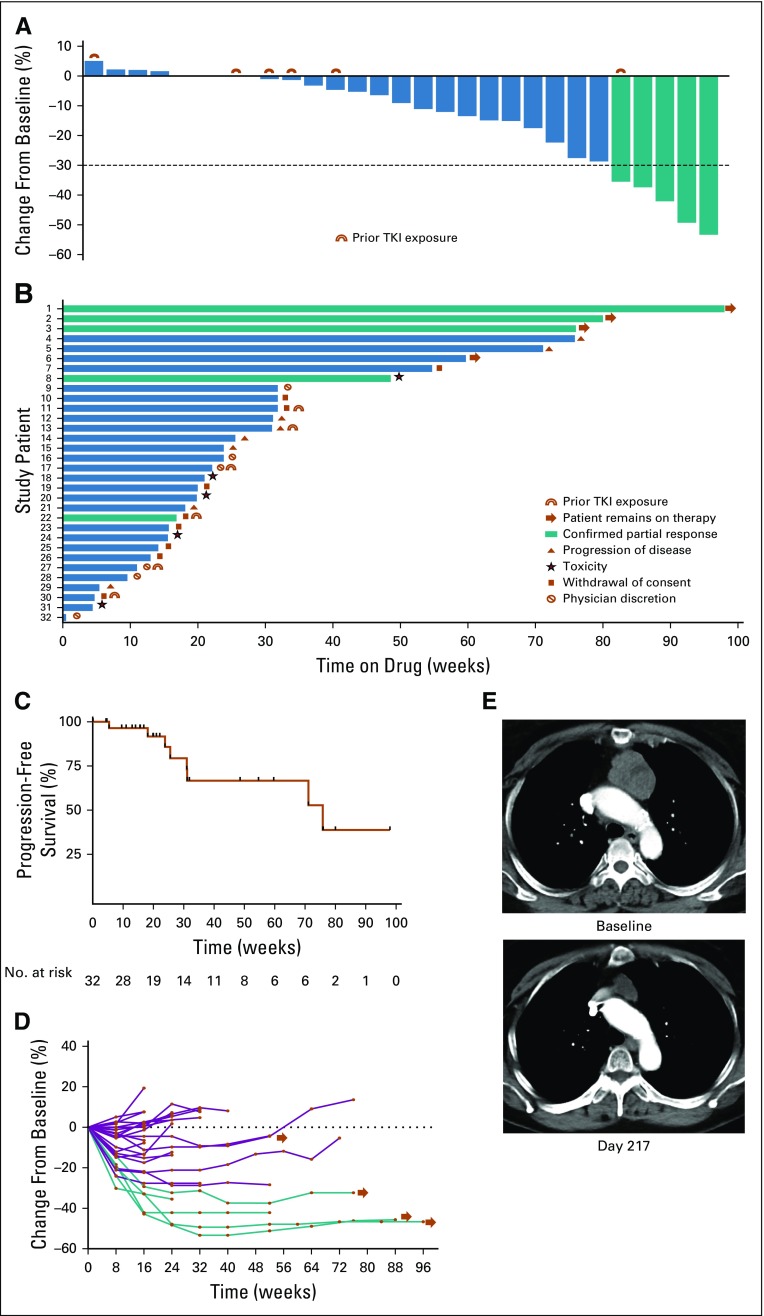
FIG 1.
(A) Waterfall plot of maximum percent change in tumor size from baseline as measured by Response Evaluation Criteria in Solid Tumor (RECIST). (B) Swimmer’s plot of time from start of therapy to time of last therapy, scan showing objective progression, or last known follow-up. (C) Kaplan-Meier estimate of progression-free survival as of May 11, 2018, defined as time from first dose until objective disease progression or death from any cause; vertical lines indicate censored events. (D) Longitudinal change in RECIST percentage from baseline. (E) Pre- and post-treatment images in a patient with a partial response. Green indicates patients with confirmed partial response. Blue indicates patients with stable disease or progression of disease as best response. TKI, tyrosine kinase receptor.

