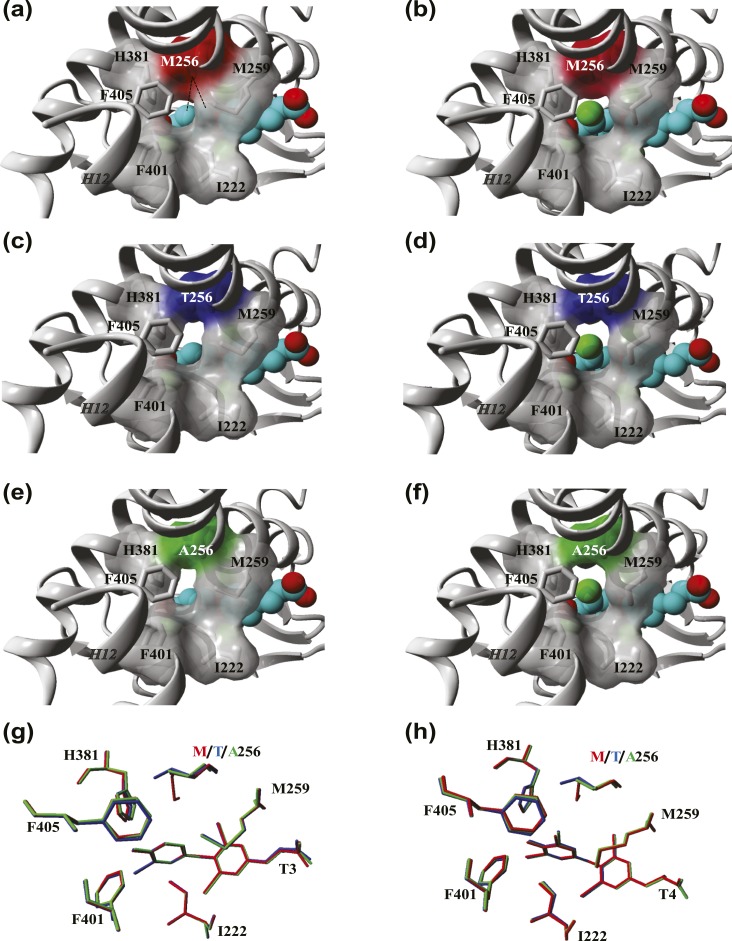
Figure 2.
Comparison of the architecture of the TRα1 ligand binding pocket in the presence of T3 and T4. (a and b) Close-up view of the ligand-binding pocket of the TRα1 crystal structure in complex with (a) T3 (PDB ID: 2h77) and (b) T4. The residue side-chains lining the niche that accommodates the outer ring of T3 and T4 are highlighted, and their molecular surface is shown except for Phe405 for clarity. The 5′-iodine group of T4 is represented by the green ball in the T4-bound TRα1 model. The hydrophobic contacts between Met256 and the phenolic outer ring are depicted as dashed lines. (c and d) Structural models of the TRα1-M256T mutant in complex with (c) T3 and (d) T4. (e and f) Structural models of the TRα1-M256A mutant in complex with (e) T3 and (f) T4. (g and h) Overlay of the structural orientation of the residue side-chains that face the (g) T3 and (h) T4 ligands at the 5′ position in WT (gray), M256T (blue), and M256A (red) mutant TRα1 models. All figures were created in YASARA Structure using PovRay imaging software.

