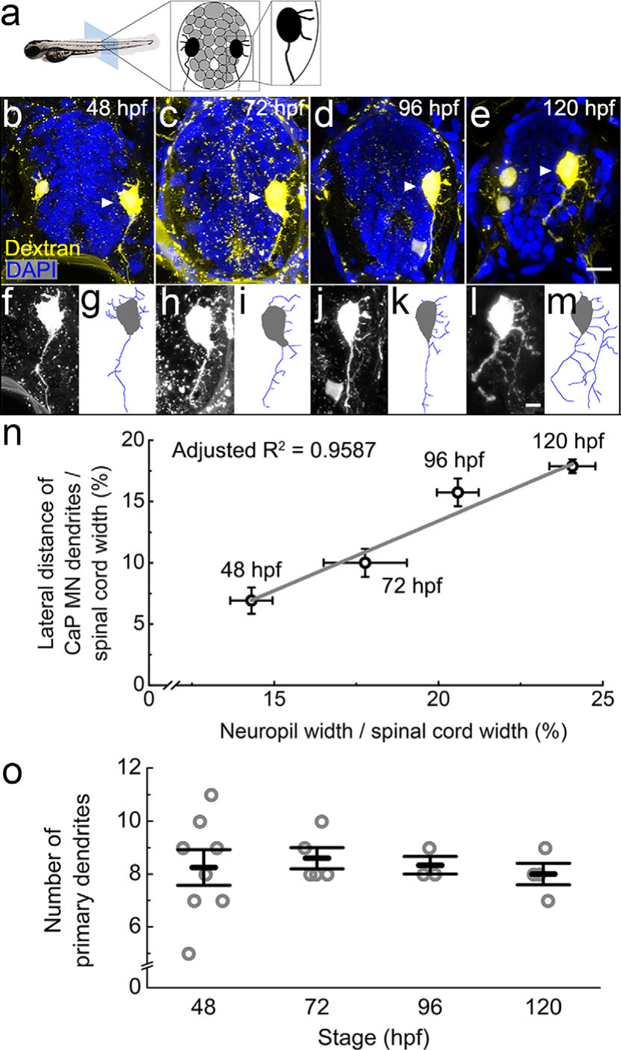
FIGURE 11.

Primary motor neurons extend dendrites into the growing lateral neuropil from 48 to 120 hpf. (a) The diagram shows the organization of tightly packed cell bodies (gray) in a spinal cord transverse section. Black cells represent the primary motor neurons whose axons exit the spinal cord to innervate muscle. (b–e) Representative images show full spinal cord transverse sections with retrogradely labeled motor neurons injected with Texas Red dextran (yellow) at four developmental stages, 48 (b), 72 (c), 96 (d), and 120 hpf (e). DAPI labels nuclei (blue). To capture dendritic morphology, the motor neuron channel is a z-projection of confocal images from a 30-μm transverse section. In 48 and 120 hpf images, some ventral-projecting secondary motor neurons are also labeled. Caudal primary motor neurons are indicated by white arrowheads. Since other tissues also take up the dextran, which happens more often at earlier stages, speckled background staining and boundary of the spinal cord are also visible. Scale bar, 10 μm. (f–m) Zoomed-in images of the labeled caudal primary motor neurons (f, h, j, and l) as well as tracings of the dendritic arbor (g, i, k, and m) at 48 (f, g), 72 (h, i), 96 (j, k), and 120 hpf (l, m). Scale bar, 5 μm. (n) There is a strong correlation between the longest motor neuron dendrite and the width of the spinal cord during development. Data represent the means at four developmental stages, 48, 72, 96, and 120 hpf. Error bars represent the standard error of the mean (neuropil width: 48 hpf, n = 15 fish; 72 hpf, n = 19 fish; 96 hpf, n = 15 fish; 120 hpf, n = 9 fish; motor neuron dendrites: 48 hpf, n = 7 neurons; 72 hpf, n = 8 neurons; 96 hpf, n = 9 neurons; 120 hpf, n = 4 neurons). Adjusted R2 = 0.9759 (p ≤ .01). (o) Numbers of primary dendrites per caudal primary motor neuron during development. Each circle represents one individual caudal primary motor neuron. Error bars represent the standard error of the mean. No significant difference is found between different stages (one-way ANOVA, F(3,16) = 0.14, p = .9335)
