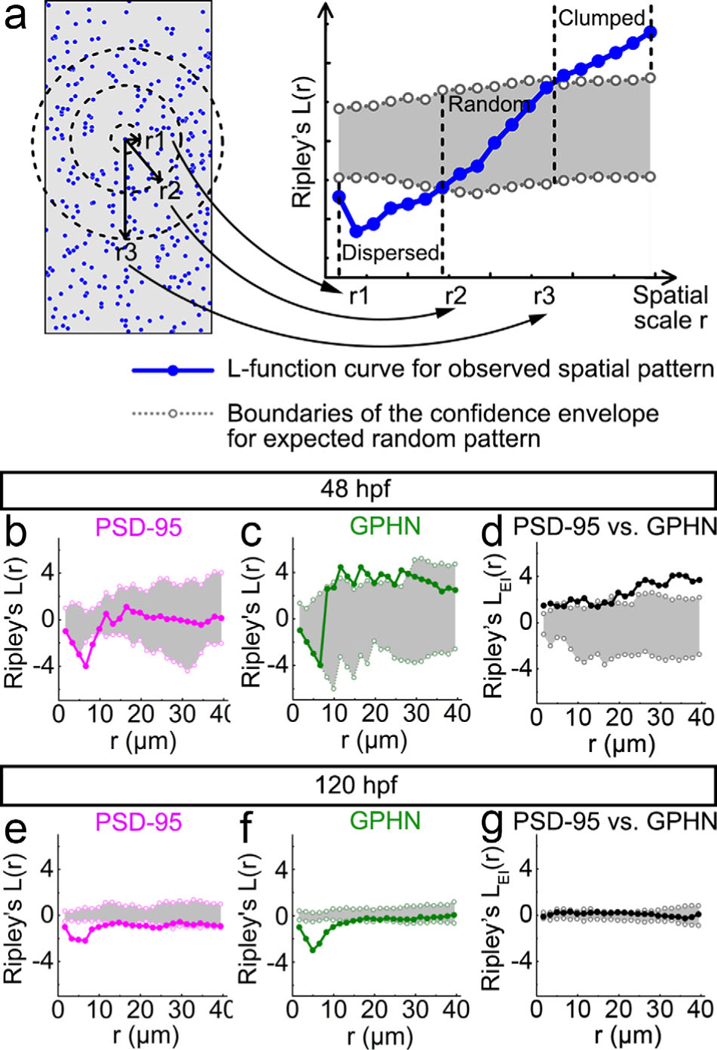
FIGURE 5.

Point-pattern analysis of postsynaptic density 95 (PSD-95) and gephyrin (GPHN) puncta shows that GPHN puncta cluster more tightly than PSD-95 puncta. (a) Illustration for the numerical implementation of Ripley’s L-function. The left diagram represents a puncta distribution (blue puncta), with r1, r2, and r3 representing different spatial scales (black). The number of puncta inside the circle with radius r is calculated and compared to the number calculated according to a null model of random distribution. Only the puncta within the defined study area (gray) are included in the analysis. The r1, r2, and r3 spatial scale values correspond to the r1, r2, and r3 values on the x-axis of the L-function plot on the right. The L-function curve for the given puncta spatial pattern is indicated in blue with the 95% confidence envelope for random distribution indicated in gray. The position of the L-function curve at a given spatial scale relative to the confidence envelope reveals the spatial pattern of the given puncta distribution: clumped/clustered (above the envelope), random (within the envelope), or dispersed/regular (below envelope). (b–g) Ripley’s L-functions are calculated separately for PSD-95 (b, e) and GPHN puncta (c, f), and together for the relative localization of PSD-95 and GPHN puncta (d, g) at48 (b–d) and 120 hpf (e–g). In each L-function plot, the L-function curve is indicated by solid line with darker color and filled circles, and boundaries of the confidence envelope are indicated by the light-colored dotted lines with open circles. The x-axis shows the scale radius (r), ranging from 0 to about half the height of spinal cord transverse sections, 40 μm. Each L-function graph is generated from images of 15 fish from 3 independent experiments
