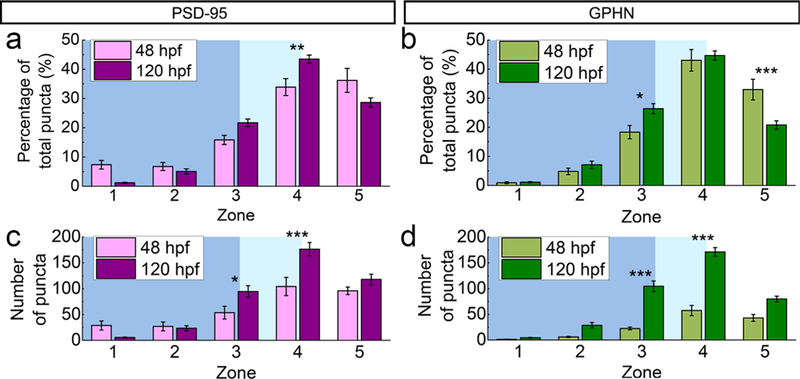
FIGURE 9.

Developmental changes of postsynaptic density 95 (PSD-95) and gephyrin (GPHN) puncta in their M-L distributions. (a, b) Bar graphs compare puncta percentages at 48 and 120 hpf in the five M-L zones for PSD-95 (a) and GPHN puncta (b). (c, d) Bar graphs compare puncta numbers at 48 and 120 hpf in the five M-L zones for PSD-95 (c) and GPHN puncta (d). Statistical tests for both comparisons are three-way ANOVA, followed by post hoc Bonferroni corrections. Asterisks indicate statistical significance (*p ≤ .05, **p ≤ .01, ***p ≤ .001)
