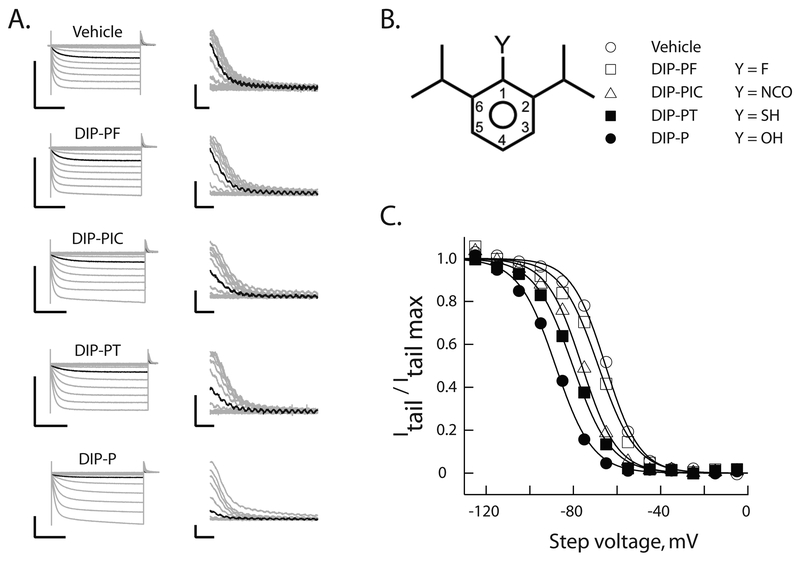
Figure 2: Hydrogen bond functionality at position 1 is important for alkylbenzene inhibition of HCN1 gating.
A. Representative voltage-clamp recordings of HCN1 currents (left) following incubation for 20 min in the absence or presence of 10 μM of the indicated reagent. Tail currents (right) are shown on expanded scales. In each case the black trace is the current recorded at an activation potential of −65 mV. To permit comparison, all recordings were obtained on the same day from distinct oocytes from a single donor frog. Scale bars are 2 μA and 1s (left) and 200 nA and 50 ms (right).
B. Schematic representation of 2,6-di-iso-propyl phenyls. Substitutions at the 1-position (as per the legend) describe molecules whose effects are reported in A and C.
C. Normalized steady-state activation curves constructed from the records shown in A. The smooth lines are fits of the Boltzmann function. Symbols represent molecules as described in B.

