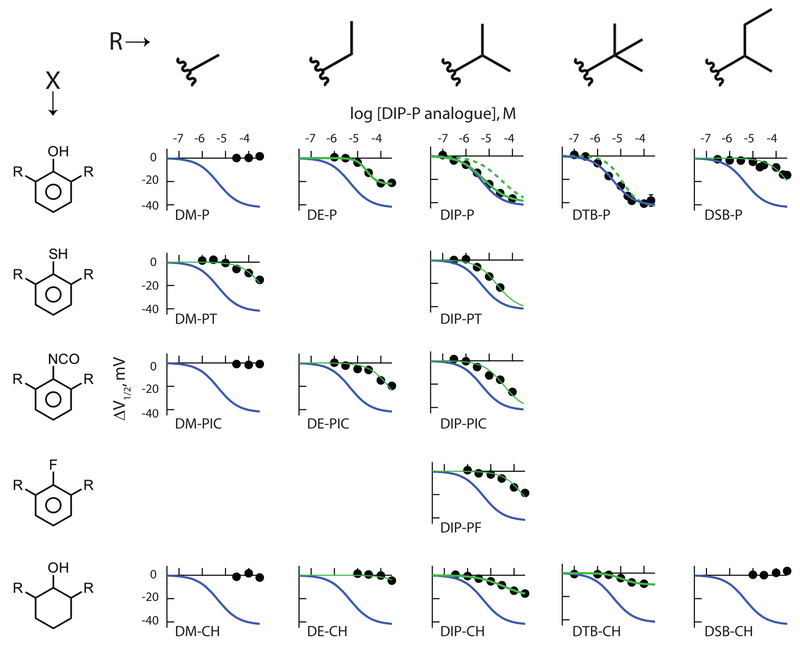
Figure 3: Inhibition by 2,6-di-alkyl phenyl derivatives reveals hydrogen bond potential, alkyl side chain identity and the presence or absence of π electrons (and/or ring planarity) all contribute to ligand association with HCN1 channels.
Panels show the shift in the V1/2 as a function of concentration of each of the indicated ligands. Thick blue lines are the fit of the Hill equation to the DTB-P data, reproduced to facilitate visual comparison. Solid thick green lines are fits of the Hill function to ligands (other than DTB-P) that clearly demonstrated full (DIP-P) or partial (DE-P, DIP-CH, DTB-CH – see text and Figure 5) inverse agonist behavior. The dashed green lines in the DIP-P and DTB-P panels are scaled representations of the Hill fits to DIP-CH and DTB-CH, respectively with the cyclohexanol fit lines scaled according to the ratio ΔV1/2 max Phenol / ΔV1/2 max Cyclohexanol with all other terms of the cyclohexanol fit unaltered. The thin green lines are fits of the Hill equation to ligands whose efficacy is poorly determined (DM-PT, DE-PIC, DE-CH, DIP-PT, DIP-PIC, DIP-PF, DSB-P) wherein the ΔV1/2 max and h were held equal to the DTB-P values, with only the IC50 allowed to optimize. The number of independent determinations in each panel were: (phenols) 14, 44, 64, 165, 122; (thiols) 67, 45; (isocyanates) 15, 45, 47; (fluoro) 61; (cyclohexanols) 14, 25, 100, 53, 19.

