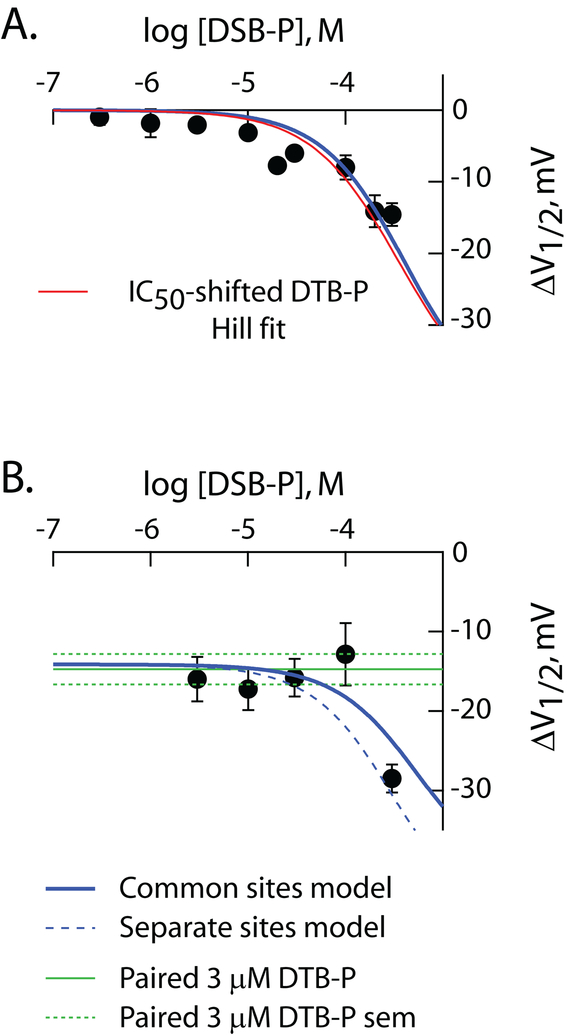
Figure 6: DSB-P is a low potency, high efficacy, inverse agonist.
ΔV1/2 as a function of concentration of DSB-P in the absence (A) and presence (B) of 3 μM DTB-P. Data in A are from Figure 3. The data in B are from 32 independent recordings. In both panels, the solid blue lines are simultaneous fits of the common site model (S=4) to the data in these two panels with all constants other than JOI and JcI held equal to the values determined in Figure 5 (see Table 4). JOI and JcI as determined from these fits were 881 ± 1,801 and 3,696 ± 2,948, respectively. The dashed blue line in B is the predicted behavior for the distinct site model at S=4 with parameters as described above. Discrete fits of the four models yielded χ2 values of 165 and 167 (distinct site) and 600 and 128 (common site) at S equal to 1 and 4, respectively. The symbols and red line in A are the observed ΔV1/2 for DSB-P and IC50-adjusted DTB-P fit line (IC50 set to 355 μM) reproduced from the DSB-P panel of Figure 3. In B, the green lines report the mean value of ΔV1/2 (solid) and SEM (dashed) elicited by 3 μM DTB-P in paired controls.

