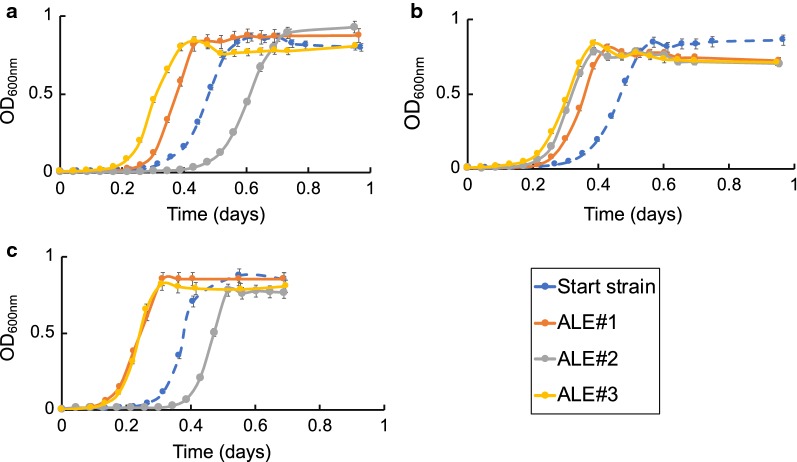
Fig. 3.
Growth profiles of ALE clones isolated from the end populations of the evolution experiments versus starting strains on M9 minimal medium with 20 g/L sucrose. Error bars represent standard deviation (n = 3). MG1655 construct with csc (MGcscBKA) growth profile is represented on a, MGcscBKA derivatives with cscB SNP (MGcscBKAp) mutation on b and E. coli W strain on c. Optical density measurement at OD600 were measured on a plate reader and the common ratio between the plate reader OD600 and a benchtop spectrophotometer with a 1 cm path length is 4.2

