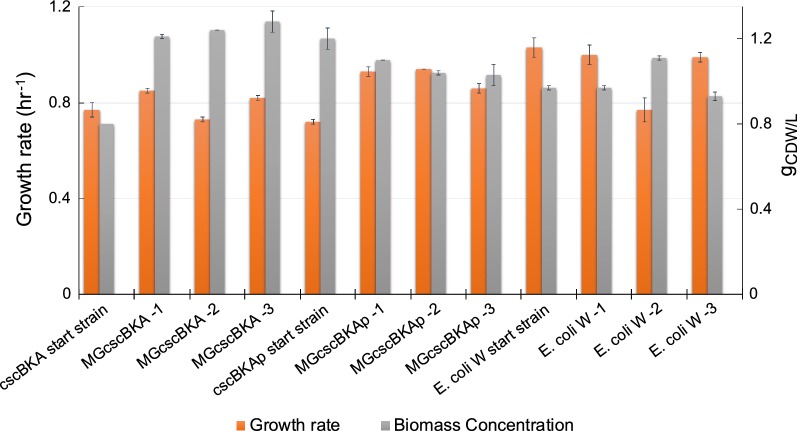
Fig. 4.
Characterization of the isolated sucrose-evolved clones on 2 g/L glucose M9 minimal medium. Shown is a stacked histogram of growth rate (h−1, orange) of the selected clones and their corresponding final cellular density (gCDW/L, grey). The plot shows that mutations acquired during the ALE experiment on sucrose were also largely beneficial, to a similar extent, on glucose as a sole carbon source. Error bars represent standard deviation of biological replicates (n = 3). Data is shown for both the starting strains and evolved clones for the three different sets of evolved strains

