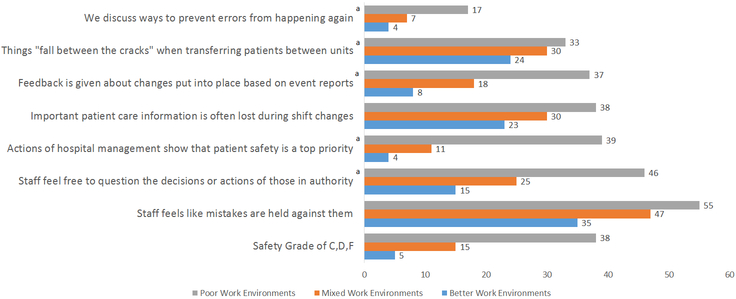
Figure 2. Percentage of Nurses Reporting Patient Safety by Work Environment Categories.
Methods: This figure presents pediatric nurse ratings (n=1875) of the specific PES-NWI survey items that relate to safety culture (n=7 statements, and the overall safety grade) and the quality of their clinical work environment. The work environment is categorized into poor, mixed, and best corresponding to the top 25%, middle 50%, and bottom 25% of the composite score distribution in the sample. Some items, (noted with an “a”) indicate that the statements were reverse coded such that agree and strongly agree are negative (undesirable) responses. Results: There was significant variation in safety culture responses across the work environment categories. In hospitals with better work environments, nurses are consistently more likely to report the presence of favorable safety-related actions in their workplace as compared with those in poor environments. The nurse responses to the individual safety culture-related statements follow the same general pattern as overall safety grade by work environment quality.
a Indicates the item is reverse recoded such that agree and strongly agree are negative, that is, undesirable responses

