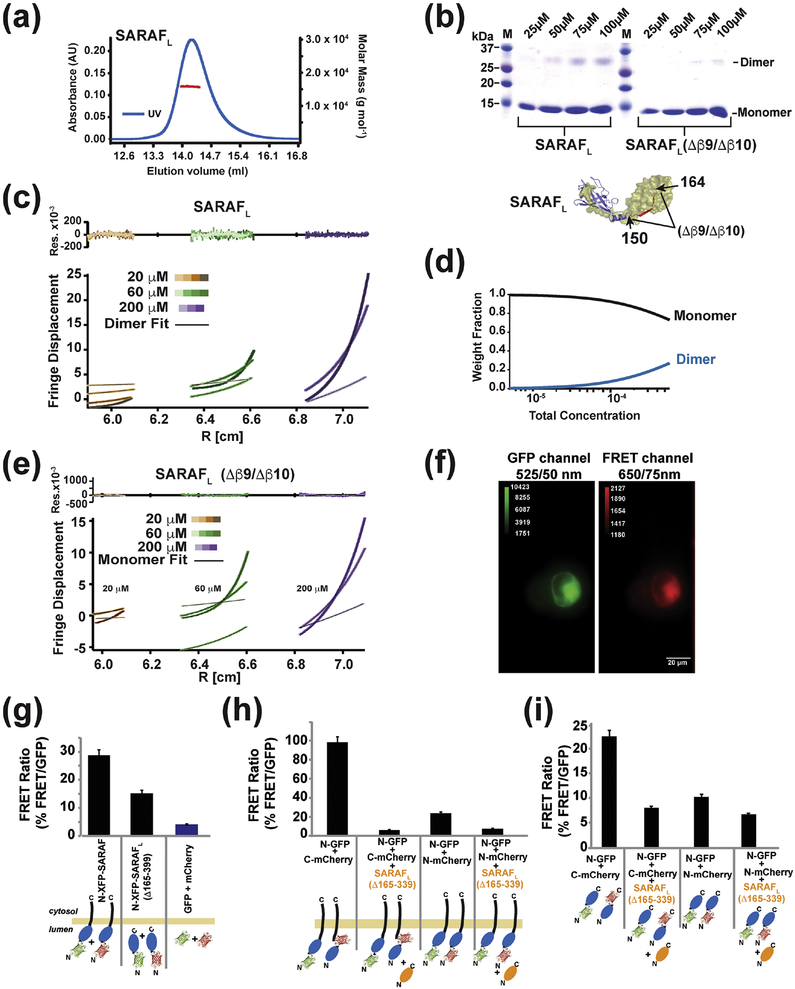
Fig. 5. SARAF self-association requires the SARAF luminal switch domain.
(a) SEC-MALS of 64 μM (1 mg ml−1) SARAFL (experimental Mw 15.84 kDa ± 0.08, Mw/Mn = 1.000 ± 0.007, predicted monomer Mw 15.49 kDa). (b) SDS-PAGE of glutaraldehyde crosslinked SARAFL and SARAFL (Δβ 9/Δβ 10) as a function of protein concentration indicates SARAFL dimerization. (c) Equilibrium ultracentrifugation of SARAFL at the indicated concentrations. Rotor speeds of 10K, 18K, 22K and 31K rpm are denoted by increasingly darker shades for each concentration. Residuals show fits to a monomer-dimer self-association model. (d) Calculated fraction of monomer and dimer SARAFL species as a function of concentration. (e) Equilibrium ultracentrifugation of SARAFL (Δβ 9/Δβ 10) at the indicated concentrations. Rotor speeds of 10K, 18K, 22K and 31K rpm are denoted by increasingly darker shades for each concentration. Residuals show fits to a single species model. (f) Example of images taken of cells expressing GFP-SARAF and mCherry-SARAF using DualView. The red channel is the FRET signal. (g) Bar graph describing the FRET/GFP signal ratio of acquired images as described in (f). Fluorescent tags are fused N-terminally to SARAF or SP-SARAFL-R (SARAF luminal domain (Δ165–339) with a signal peptide, SP, and an ER retention signal, R). Signals from cells expressing monomeric SP-GFP-R and SP-mCherry-R are used to establish the background signal. (h) SP-SARAFL-R (orange) inhibits the FRET signals between XFP-SARAF and (i) N-terminally tagged, SP-XFP-SARAFL-R, or C-terminally tagged, SP-SARAFL-XFP-R, luminal domains. For (g-i) *** denotes p<0.001. n for each combination is denoted above the bars.

