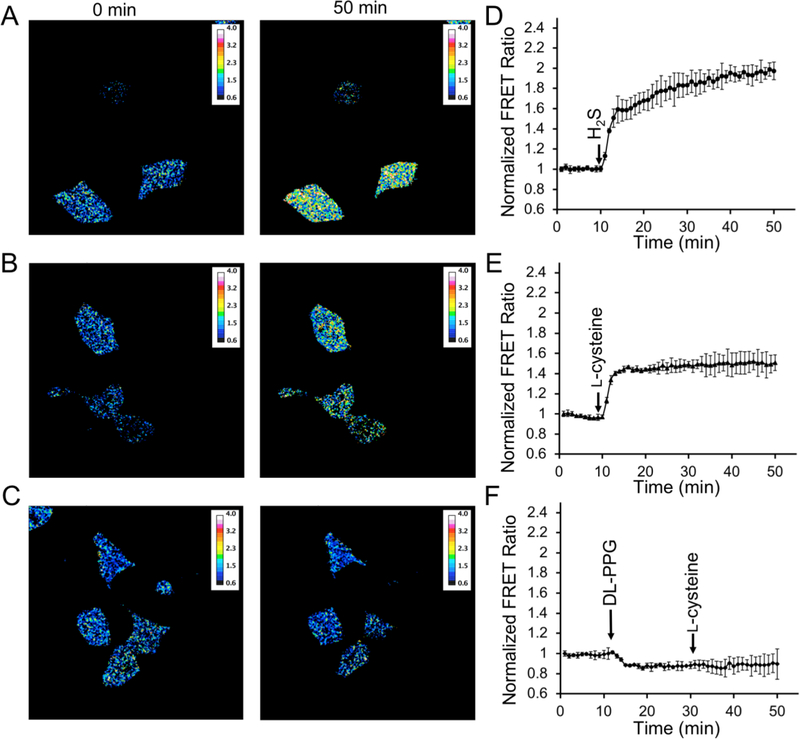
Figure 4.
Use of hsFRET to image H2S in mammalian cells. (A–C) Pseudocolor ratiometric images of HEK 293T cells treated with (A) 100 μM H2S (NaHS in DPBS, pH 7.4 as the donor), (B) 100 μM L-cysteine, or (C) 50 mg/L DL-PPG for 20 min, followed by 100 μM L-cysteine. (D–F) Quantification results for panels A–C as the mean and s.d. of all imaged cells from three independent replicates. FRET ratios were normalized to the value at t = 0 min.

