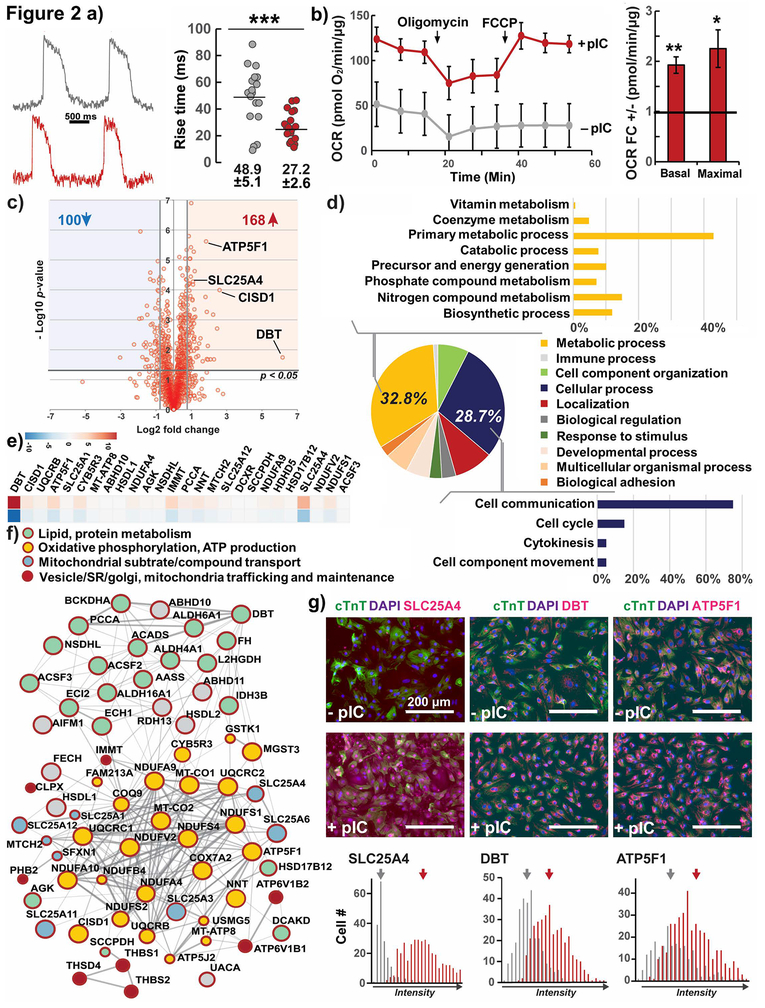
Figure 2. Functional and proteomic analysis of maturation in hPSC-CMs, effect of pIC treatment of CPCs.
a) Optical upstroke velocity with the voltage-sensitive dye RH237 (quantified by time required to traverse 10 to 90% action potential amplitude, rise time) for day 30 hESC-CMs, individual cells plotted from 4 cell preparations.
b) Seahorse quantification of Oxygen Consumption Rate (OCR) normalized to total protein fold change of hESC-CMs from primed to untreated CPCs, n=4
c) Global quantitative bottom up proteomic analysis of up- and downregulated proteins as volcano plot of hESC-CMs from primed CPCs compared to no treatment.
d) Ontology analysis revealed the majority of the up-regulated proteins were involved in primary metabolic processes and cell communication.
e) Heat-map of the top 34 upregulated proteins involved in metabolic processes and mitochondrial function.
f) Protein-protein interaction network of upregulated metabolic proteins, predominantly involved in oxidative phosphorylation and ATP production (yellow), as well as lipid/amino acid metabolism (green). Proteins important for mitochondrial substrate/compound transport (blue) and the crosstalk of mitochondrial and SR/Golgi compartments (red) were also upregulated. Full interactome see Fig. S4c.
g) Immunostaining and quantification of mean fluorescence of three top upregulated metabolic proteins. Means labeled. Unmerged images see Fig. S4d.
Test P *< 0.05, **<0.01, ***< 0.001; hESC line H9-TNNT2-GFP

