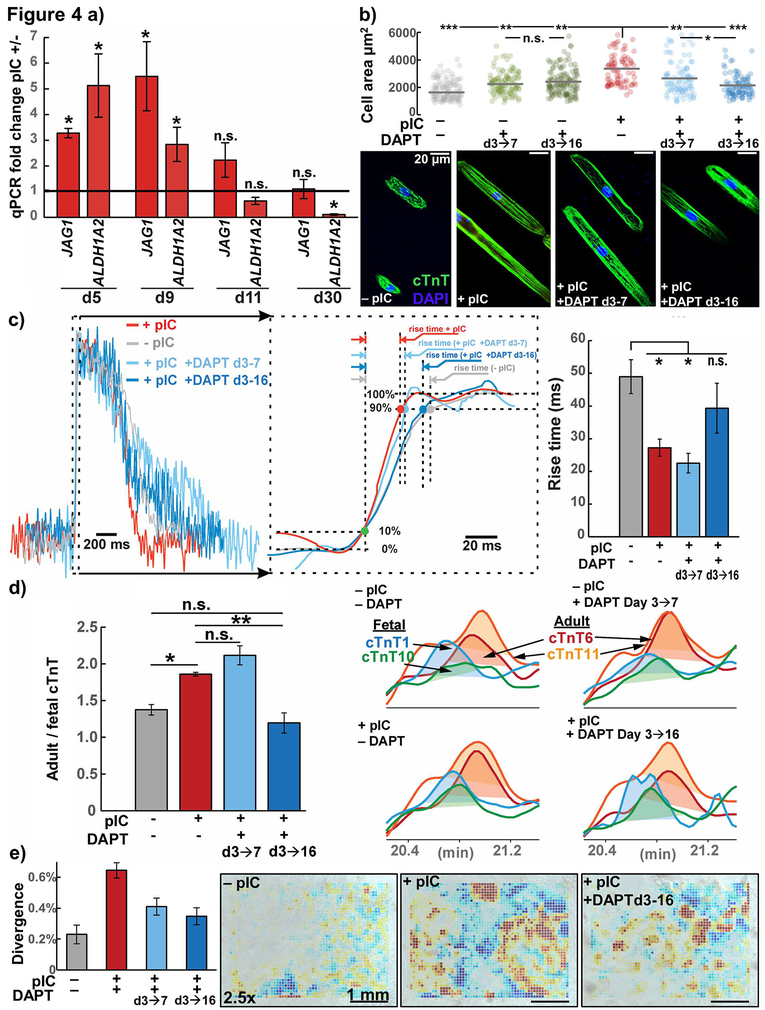
Figure 4. Notch inhibition blocks acceleration of hPSC-CM maturation induced by pIC treatment of CPCs.
a) RT-qPCR expression of top Notch pathway associated genes from Fig. 3c, JAG1 and ALDH1A2, at the progenitor stage (day 5), earliest cardiomyocytes (day 9, 11), and later (day 30) using hiPSC line DF19-9-11, n = 3–4.
b) Confocal microscopy with morphology analysis cTnT-immunolabeled hiPSC-CMs from cells treated with indicated conditions, dissociated and cultured for 1 week on 30 μm wide Matrigel patterned lanes on PDMS substrate, n=6. ANOVA P < .001
c) Optical upstroke velocity measured using the voltage-sensitive dye RH237 (quantified by time required to traverse 10 to 90% action potential amplitude, rise time) from d30 hiPSC-CMs differentiated from primed and untreated CPCs, in the presence or absence of the Notch inhibitor DAPT at times indicated, n=17 individual cells from 4 passages. ANOVA P < .001
d) Top-down mass spectrometry for cTnT isoforms, AUC ratio of adult to fetal isoforms for day 30 hiPSC-CMs from primed and untreated CPCs, in the presence or absence of the Notch inhibitor DAPT, n=3. ANOVA P < .001
e) Video contractility analysis of hiPSC-CM monolayers from cells treated with indicated conditions.
t test or post-hoc Holm P * < .05, ** < .01, *** < .001; hiPSC line, DF19-9-11

