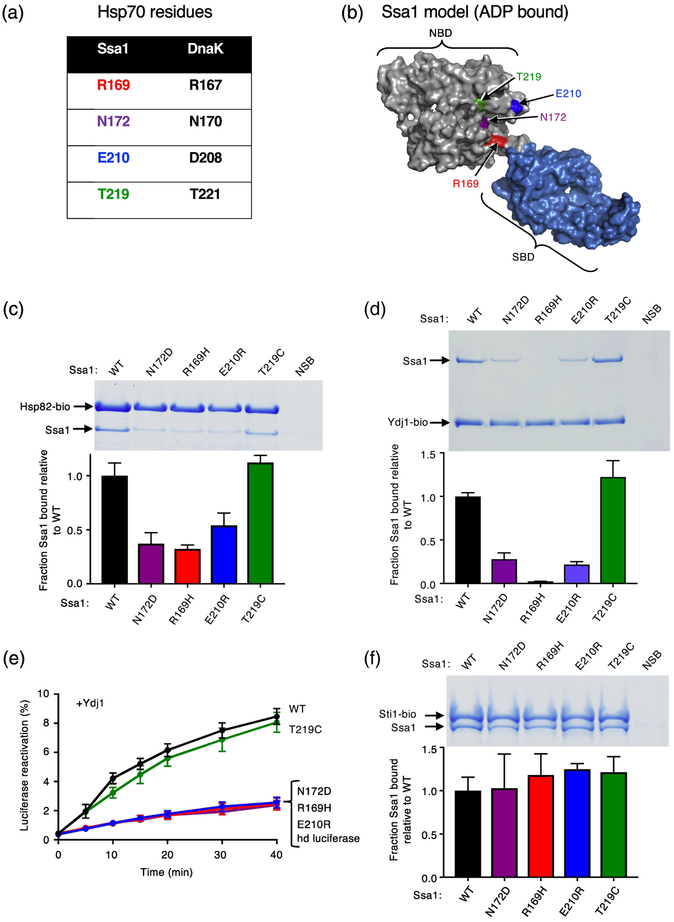
Fig. 3.
Ssa1 residues homologous to DnaK residues important for interacting with Hsp90Ec are important for Hsp82 and Ydj1 binding. (a) Chart showing residues in S. cerevisiae Hsp70, Ssa1, that align with four residues in E. coli DnaK, that were previously shown to be in the Hsp90Ec interaction region [32]. (b) Model of Ssa1 in the ADP-bound conformation (based on the ADP-bound conformation of DnaK (PDB ID code 2KHO) [33, 73] shown as a surface rendering with the NBD in gray and the SBD in blue and generated using PyMOL (https://pymol.org/2/). Residues mutated in this study and tested for interaction with Hsp82 are shown in color and labeled. (c) The in vitro interaction between biotinylated Hsp82 (2.5 μM) and Ssa1 wild-type or mutant (8 μM) was monitored using a pull-down assay as described in Materials and Methods. The results were analyzed by SDS-PAGE followed by Coomassie blue staining. Ssa1 wild-type or mutant associated with biotinylated Hsp82 was quantified using densitometry as described in Materials and Methods and is shown as a bar graph. For each lane of the gel, the amount of Ssa1 was corrected for non-specific binding (NSB) and then was normalized to Hsp82-biotin and the ratio of Ssa1 mutant to wild-type is plotted. (d) The in vitro interaction between biotinylated Ydj1 (1.2 μM) with Ssa1 wild-type or mutant (2 μM) was monitored using a pull-down assay as described in Materials and Methods. The results were analyzed by SDS-PAGE followed by Coomassie blue staining. Ssa1 wild-type or mutant associated with biotinylated Ydj1 was quantified using densitometry as described in Materials and Methods and is shown as a bar graph. For each lane of the gel, the amount of Ssa1 was corrected for non-specific binding (NSB) and then was normalized to Ydj1-biotin and the ratio of Ssa1 mutant to wild-type is plotted. (e) Heat-inactivated luciferase reactivation by Ssa1 wild-type or mutant and Ydj1 as indicated and described in Materials and Methods. Data from three or more replicates are presented as mean ± SEM. For some points, the symbols obscure the error bars. (f) The in vitro interaction between biotinylated Sti1 (2 μM) and Ssa1 wild-type or mutant (4 μM) was monitored using a pull-down assay as described in Materials and Methods. The results were analyzed by SDS-PAGE followed by Coomassie blue staining. Ssa1 wild-type or mutant associated with biotinylated Sti1 was quantified using densitometry as described in Materials and Methods and is shown as a bar graph. For each lane of the gel, the amount of Ssa1 was corrected for non-specific binding (NSB) and then was normalized to Sti1-biotin and the ratio of Ssa1 mutant to wild-type is plotted. In (c, d and f), the gels shown are representative of at least three independent experiments and quantification of the data from three or more replicate gels are presented as mean ± SEM.

