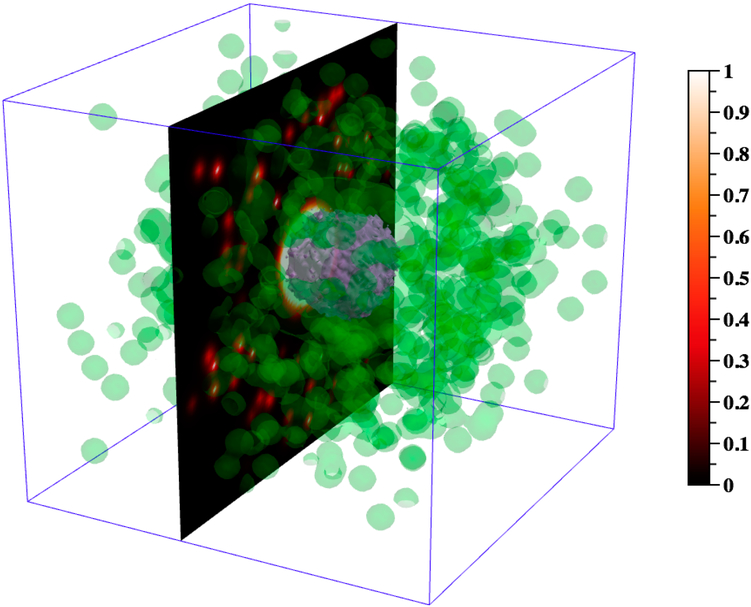
Figure 4.
Visualizing the simulated TNF chemical gradient at day 50 post infection for one simulation, using DataTank. This figure; depicts the TNI gradient at day 50 using; two different methods: (i) a 2D, yz-slice at x = 50, and (ii) 3D level sets. In (i) we show the; 2D TNF gradient using the color bar on the right to define concentration intensity. In (ii) we use 3D level sets to depict the 3D spatial distributions of two biologically relevant TNF concentrations for macrophage recruitment. The green 3D surface encloses grid compartments in which the TNF concentration is 0.05 or greater (i.e., level set = 0.05). The 0.05 value represents the minimum concentration that macrophages can sense, and thus a concentration below this value is not detectable by macrophages. The purple 3D surface encloses grid compartments in which the TNF concentration is 50 or greater (i.e., level set = 50). The 50 value represents the maximum concentration that macrophages can sense, i.e., the concentration at which a compartment is considered “saturated” for macrophage sensitivity (~99% saturation according to Michaelis-Menten kinetics).

