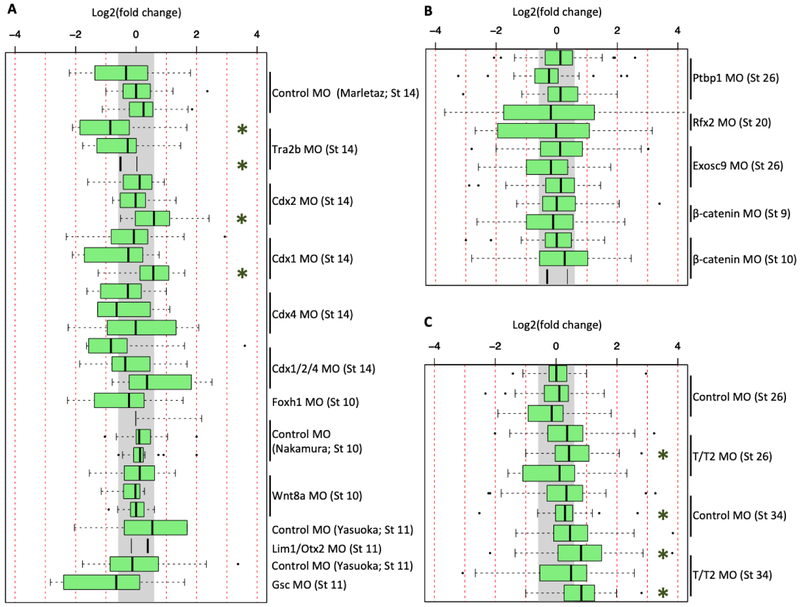
Figure 3. Expression of literature-identified innate immune response genes in X. tropicalis and X. laevis RNA-seq datasets.
Fold change expression of innate immune response genes across 29 datasets in X. tropicalis (A), 13 datasets in X. laevis (B), and in 12 the tbxt/t2 MO datasets (C). Gray region indicates fold change of < 1.5x. Green asterisk (*) indicates a T-test p-value of < 0.01.

