Fig. 2.

The Genome View shows the chromosomes and synteny map- pings of selected species. In this example, the Static mapping is used with the Faded color palette.

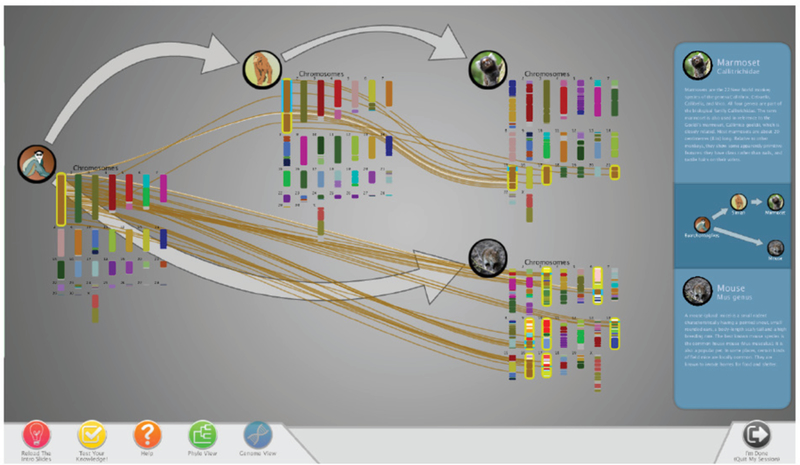
The Genome View shows the chromosomes and synteny map- pings of selected species. In this example, the Static mapping is used with the Faded color palette.