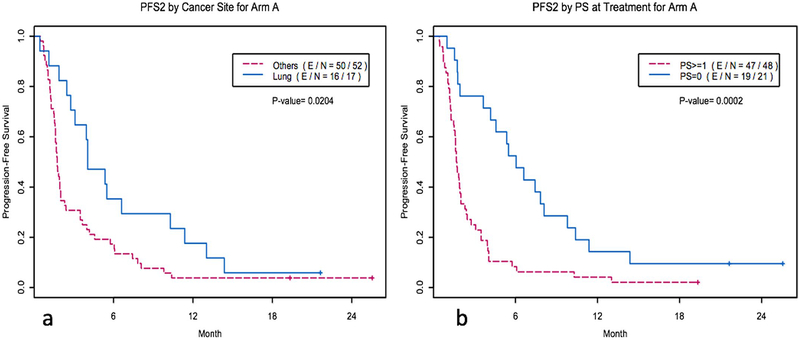
Extended Data Fig. 2 |. Kaplan-Meier curves of various factors influencing PFS and OS.
a, Kaplan-Meier curves of PFS for arm A by cancer site (lung site, N = 17 versus other site, N = 52). PFS2 denotes the PFS of the WINTHER treatment. P = 0.0204 by two-sided log-rank test. b, Kaplan-Meier curves of PFS for arm A by ECOG performance status at treatment (PS = 0, N= 21 versus PS = 1, N = 48). PFS2 denotes the PFS of the WINTHER treatment. P= 0.0002 by two-sided log-rank test.

