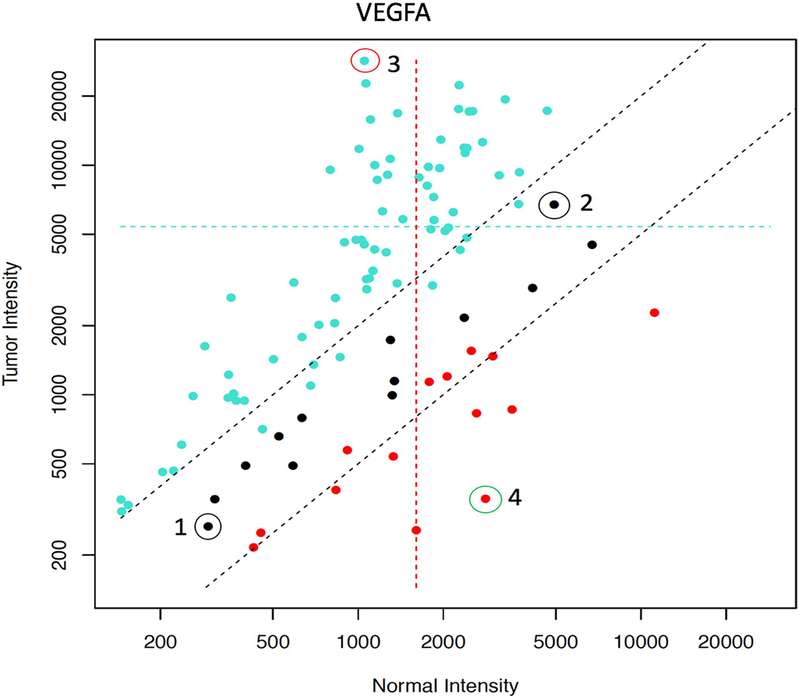
Extended Data Fig. 6 |. Effect of individual variability of normal VEGFA RNA expression on the assessment of VEGFA levels in tumors.
On the y axis, the transcript intensity in tumors is shown, and on the x axis the transcript intensity in matched normal biopsies is shown. Intensities are measured as a relative fluorescence unit (RFU) signal as assessed with Agilent microarray technology. Overexpression in the tumor is denoted in turquoise points, underexpression is denoted in red and no change is denoted in black. The twofold threshold (both high and low) is indicated by two dotted black lines. All 101 patients of the WINTHER study with evaluable RNA data were considered. Example 1 shows a patient with a low level of basal expression (300 RFU) in the tumor and 300 RFU in the normal biopsies, with no differential expression between the normal and tumor biopsies. Example 2 shows a patient with a high level of basal expression of 6,000 RFU in the tumor versus 6,000 RFU in the normal biopsies, but again no differential expression between the tumor and normal counterpart. Example 3 marked in turquoise shows the pattern of a higher expression in tumor versus normal tissue. Example 4 marked in red shows the pattern of a lower expression in tumor versus normal tissue. This current study hypothesizes that simultaneously investigating the matched phenotypically normal tissue can help to optimize transcriptomic data. With this approach, each patient serves as his or her own control, hence avoiding the use of pooled tumor or normal tissues. Our data demonstrate that the level of basal gene expression is highly variable between individuals. All patients presented with black points had no differential expression between tumor and normal tissue, but others show a large variability between individuals in the basal level of normal expression of VEGFA.

