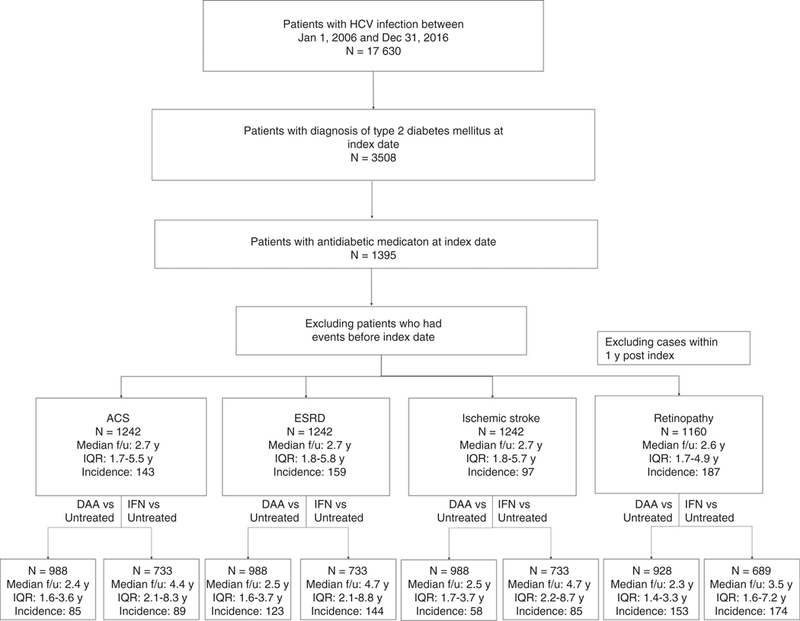
FIGURE 1.

Flow chart of patient selection process. ACS: acute coronary syndrome; ESRD: end-stage renal disease; SVR: sustained virological response; TF: treatment failure; DAA: direct-acting antiviral; f/u: follow-up; y: year; IQR: inter-quartile range
