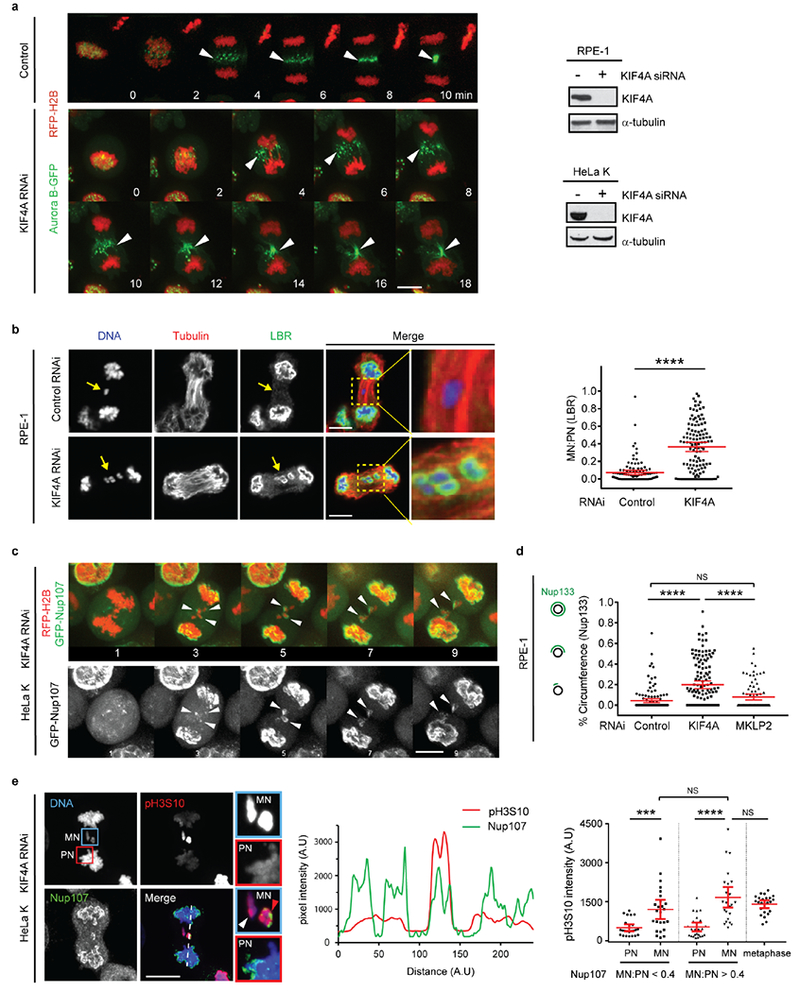
Extended Data Figure 7. KIF4A knockdown partially restores non-core NE assembly to lagging chromosomes even when they have maximal (metaphase) levels of H3S10 phosphorylation.

a, Consistent with previous studies26, KIF4A knockdown largely preserves the redistribution of Aurora B from centromeres to the central spindle (arrowheads) early in anaphase. Synchronization as in Fig. 1a. Left: Images from time-lapse series are shown from control (representative of 29 cells, from 2 experiments) or KIF4A-depleted (representative of 27 cells, from 3 experiments) HeLa K cells expressing Aurora B-GFP (green) and RFP-H2B (red). Time is shown in min (t=0, AO). Right: Western blots showing depletion of KIF4A protein by siRNA in RPE-1 (top, 3 experiments) and HeLa K (bottom, 3 experiments) cells (also related to Fig. 3b, c, for gel source data, see Supplementary Fig. 1). Scale bar, 10 μm.
b, Restoration of LBR to some lagging chromosomes after KIF4A depletion (RPE-1 cells). Synchronization as in Fig. 1a. Left: Representative images: DNA (blue), α-tubulin (red) and LBR (green). Right: MN/PN LBR FI ratio (mean with 95% CI, n=105, 119, from 3 experiments). **** P < 0.0001, two-tailed Mann-Whitney test. Scale bars, 10 μm. Note that the restoration of LBR is often continuous around MN with partially-restored MN/PN FI ratio (see also Fig. 2a after Aurora B inhibition), whereas the NPC assembly is commonly restored discontinuously after KIF4A depletion (see Fig. 3b, c) or Aurora B inhibition (see Extended Data Fig. 8d). This is consistent with different localization patterns of LBR and NPC in the core domain on the main chromosome mass (Extended Data Fig. 1b, c, e), which may arise from their different mobilities within the NE.
c, Live-cell imaging confirming the partial restoration of an NPC protein (Nup107) to lagging chromosomes in HeLa K cells expressing GFP-Nup107 (green) and RFP-H2B (red) after KIF4A knockdown. Synchronization as in Fig. 1a. Images from a confocal time-lapse series are shown with arrows indicating GFP-Nup107 protein recruited to lagging chromosomes (representative of 6 cells, from 3 experiments). Time is shown in min. Scale bar, 10 μm.
d, Unlike KIF4A knockdown, disruption of Aurora B spindle midzone localization by MKPL2 knockdown fails to restore the recruitment of Nup133 to lagging chromosomes. Synchronization as in Fig. 1a. Graph showing quantification of the results (mean with 95% CI, n=131, 136, 85, from 2 experiments). **** P < 0.0001, NS: Not significant (P=0.0616), two-tailed Mann-Whitney test.
e, H3S10 phosphorylation does not block NPC/non-core NE assembly. Left: Representative images of KIF4A-depleted HeLa K cells showing restoration of non-core (Nup107) assembly onto lagging chromosomes with high level of H3S10 phosphorylation (red arrowhead, enlarged images of the blue boxed region). Note that the level of phospho-H3S10 is similar between the lagging chromosomes with (red arrowhead) or without (white arrowhead) Nup107 recruitment. To illustrate the relative difference in pH3S10 levels between PN and MN, pH3S10 has been scaled differently in the pH3S10 channel and the merged channel. Cells were synchronized as in Extended Data Fig. 1e. Scale bar, 10 μm. Middle: Linescan profile of the indicated proteins along the dashed line in the merged image on the left. Right: FI of phospho-H3S10 on MN and the corresponding PN (mean with 95% CI, n=24, 25, 25, 25, 24, from 2 technical replicates). In MN that have recruited Nup107 (MN/PN FI ratio >0.4), the H3S10 phosphorylation level is comparable to metaphase chromosomes. *** P =0.0009, **** P < 0.0001, NS: Not significant (P=0.0709, P=0.6699, left to right), two-tailed Mann-Whitney test.
