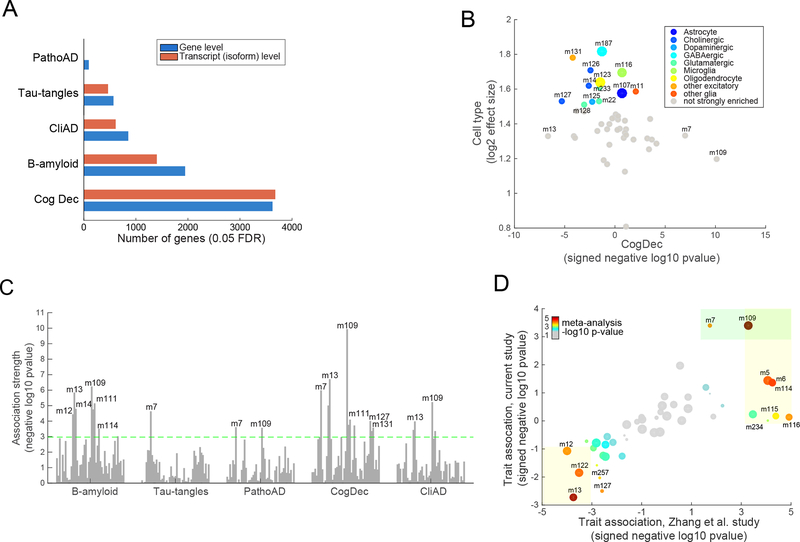
Figure 2. Characterization of human cortical RNA-Seq data and their relation with AD traits and cellular processes.
(A) Figure shows the number of genes whose gene expression levels significantly associate with each of the five tested AD-related traits (0.05 FDR). Results are shown for association testing at the “gene level” and “transcript level” (isoform level). (B) This figure shows the enrichment of each of the 47 modules for cell-specific signature genes defined in mice (y-axis) (see Supplementary methods). The X-axis shows the signed association strength (signed -log10 pvalue) between each module and cognitive decline. Larger sized points (modules) are those that we deem to most strongly represent each of the four major brain cell types: neurons (m187), microglia (m116), oligodendrocytes (123), and astrocytes (m107) (see Supplementary methods for details). (C) Figure shows the association strength (quantified as negative log10 pvalue) between each of the 47 modules of coexpressed genes (visualized as vertical bars) and each of the five tested AD-related trait (x axis). The dashed line depicts the Bonferroni-adjusted significance threshold at the module-level (p<0.001). Only some of the modules that pass Bonferroni threshold are labeled, for visualization ease. (D) This figure shows the strength and direction of each module’s association (signed negative log10 pvalue) for association with a binary diagnosis of pathological AD (PathoAD) in our ROSMAP study on the y-axis. The x-axis shows the signed association strengths between each module and pathological AD in an existing microarray dataset (Zhang et al. dataset)22. Specifically, the modules are defined using the ROSMAP samples, and their definitions are projected onto the Zhang et al. study. The size of each point represents the size of each module (i.e., number of assigned genes). The color of the point is proportional to the significance of the association in a meta-analysis of the ROSMAP and Zhang modules (using the gradient shown in the upper left portion of the graph). The light orange boxes highlight those modules that are significantly associated with PathoAD diagnosis in the microarray (“Zhang”) dataset. The green box highlights the modules that are significantly associated with a PathoAD diagnosis in the ROSMAP data.

