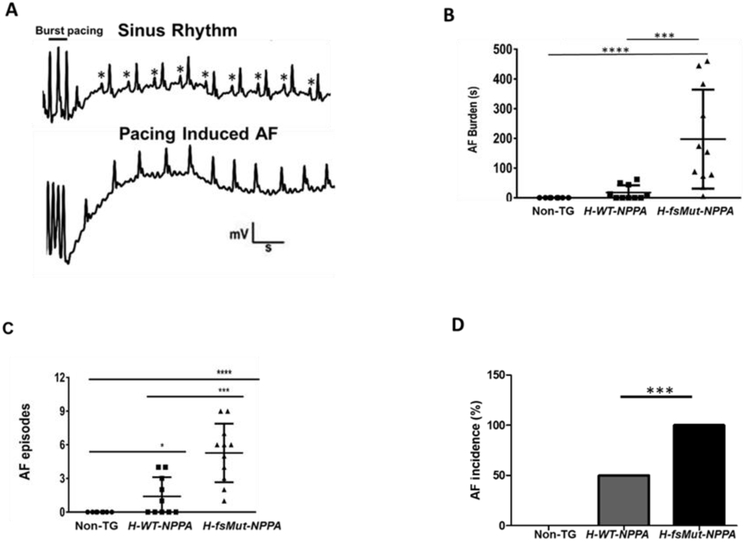
Figure 2: H-fsMut-NPPA mice are more prone to pacing-induced atrial fibrillation (AF).
A: Atrial electrograms showing sinus rhythm (*P-wave) at baseline (top) and pacing-induced AF in H-fsMut-NPPA mice (bottom). B: Burden (duration) of pacing-induced AF in individual mice across the 3 groups; n = 8, 10, and 11 respectively for Non-TG, H-WT-NPPA, and H-fsMut-NPPA mice. C: Number of AF episodes per mouse among the 3 groups. D: Incidence of AF among the 3 groups of mice. *P<0.05, **P<0.01; ***P<0.001; ****P<0.0001; data is presented as mean ± SD.

