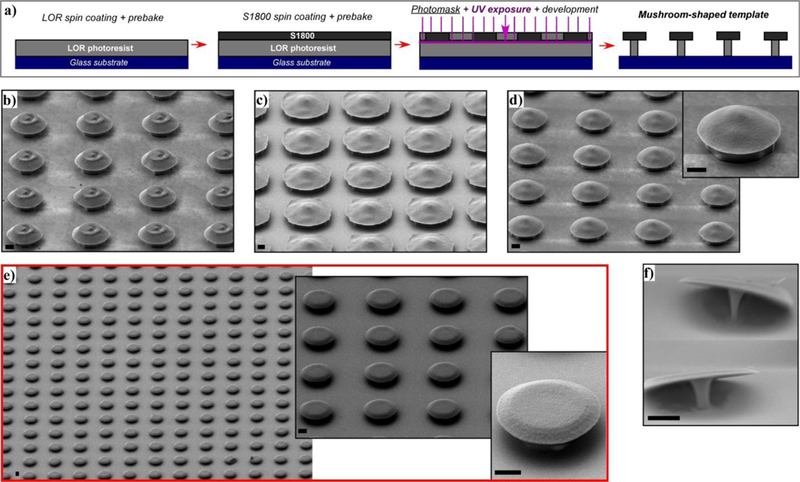
Fig. 2.

(a) Diagram of photolitography in bilayer process. SEM images of different mushroom patterns showing the effect of experimental conditions: (b) Thicker photoresist (S1818), (c) under-exposure (UV exposure t < 7s) , (d) prebake step of LOR10B (t, T > 2 min, 150 ºC), (e) optimal conditions, (f) over-development (t > 25 s). Scale bars 2 μm.
