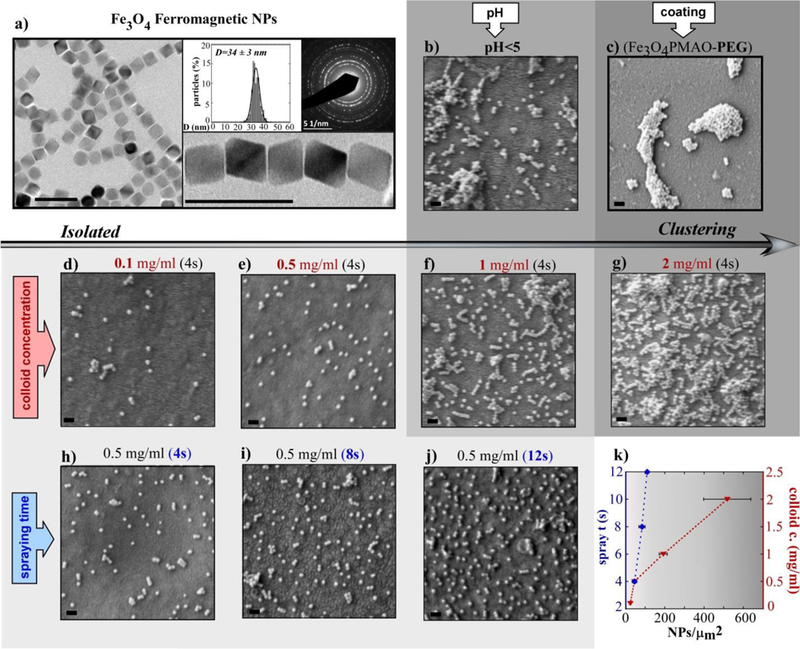
Fig. 5.

(a) TEM image of Fe3O4 F-MNPs together with the size distribution and the corresponding electron diffraction pattern; (b-j) SEM micrographs (lower magnification images in Figure S4, ESI†) of different microdiskś surfaces prepared under distinct conditions (in sample b the F-MNP colloid had pH<5, in sample c the F-MNPs were coated with PMAO-PEG, in samples d-e-f-g the concentration of the F-MNP colloid was increased from 0.1 mg/ml to 2 mg/ml, in samples h-i-j the spraying time of the F-MNPs colloid was increased from 4 s to 12 s; (k) plot summarizing the effect of the F-MNP colloid concentration and the spraying time on the number of NPs per μm2 of microdisk surface. The grey scale represents the agglomeration degree of the F-MNPs. All scale bars are 100 nm long.
