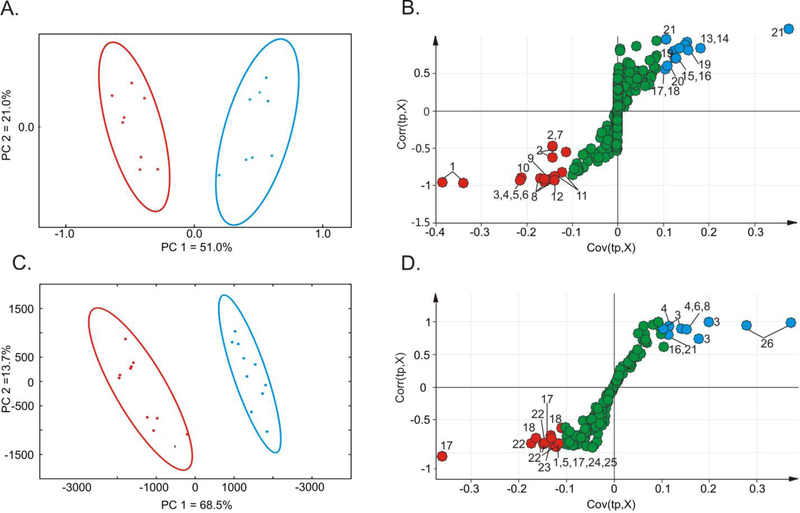
Figure 2.
PCA scores plots generated from 1D 1H NMR spectra obtained from M. smegmatis TAM23 (red) and mc2155 (blue) cell lysates (A) without or (C) with media supplemented with D-alanine. OPLS-DA S-plots comparing the 1D 1H NMR spectra obtained from TAM23 and mc2155 cell lysates (B) without or (D) with media supplemented with D-alanine. Each point in the S-plot represents a specific bin of integrals for a chemical shift range of 0.25 ppm. The points at the extreme ends of the S-plots are major contributors to class distinction. The red points represent a decrease in the binned integrals for TAM23 compared to mc2155. The blue points represent an increase in the binned integrals for TAM23 compared to mc2155. Green points represent metabolites that are approximately equally in both strains. The labeled points were assigned to the following metabolites: 1) fatty acids, 2) ethanol, 3) glutamate, 4) oxaloacetate, 5) GABA, 6) succinate, 7) glycerol, 8) isoleucine, 9) valerate, 10) lactate, 11) N-acetylglucosamine-6-phosphate, 12) α-ketoisovalerate, 13) glycolate, 14) serine, 15) phosphoserine, 16) threonine, 17) lysine, 18) alanine, 19) glucarate, 20) ATP, 21) unidentified (UD), 22) trehalose, 23) valine, 24) ornithine, 25) α-ketoglutarate and 26) citrulline.

