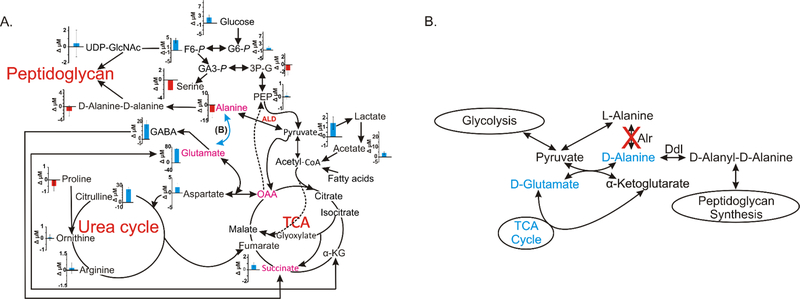
Figure 4.
(A) Metabolic network map displays the 2D 1H-13C-HSQC time zero absolute metabolite concentration differences between M. smegmatis wild type mc2155 and alr insertion mutant TAM23 grown in MADC media and treated at mid exponential phase with [13C2]-D-alanine. A positive blue bar indicates a concentration increase in mc2155 relative to TAM23. A negative red bar indicates a concentration decrease in mc2155 relative to TAM23. The plotted concentrations are on a µM scale and the error bars represent standard deviations. Metabolites highlighted in magenta exhibited a reversal in concentration depending on whether media were supplemented with or without D-alanine from the 1D 1H NMR experiments and Table 1. L-alanine dehydrogenase (ALD), highlighted in red, was overexpressed in TAM23 relative to mc2155. The dark arrows identify the primary carbon flux pathway, blue arrows represent a hypothetical pathway for D-alanine biosynthesis that is depicted in detail in (B), and the dotted lines represent established alternative routes. (B) Metabolic network summarizing the 1D 1H NMR data and the L-D amino acid pools (see Fig. 1D and Table 1) comparing mc2155 with TAM23 from cultures without supplemental D-alanine. Metabolites colored blue were observed to increase in mc2155 relative to TAM23. Diagram adapted from Halouska et al. 2014.51

