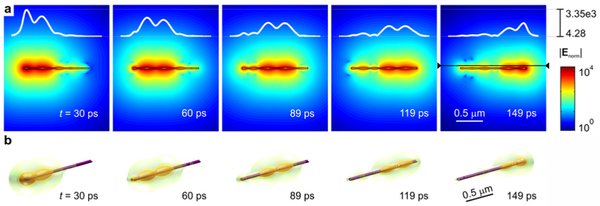
Figure 17.
Ultrafast sub-nanosecond scale electric phenomena predicted in MTs (cytoskeleton protein fibers), image adapted from [139]. (a) Propagation of the electric pulse along the MT. Normalized intensity of the electric field is depicted in a logarithmic scale according to the presented color-bar. The shape of the pulse, as an electric field intensity along the line parallel to the MT axis in the distance of 43 nm from the wall of the MTs, is shown by the white line, on a linear scale. (b) An isosurface of the electric field intensity is used to visualize the shape of the pulse and its propagation in 3D.

