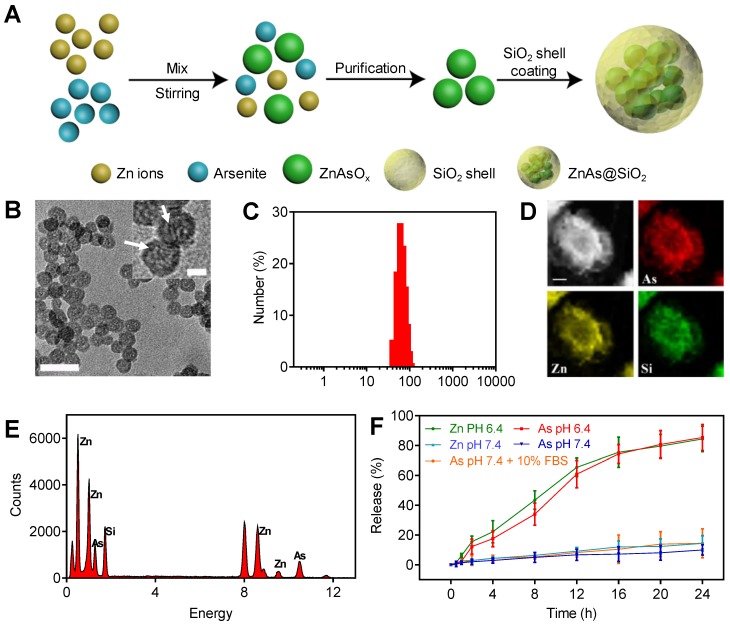
Figure 1.
Synthesis and characteristics of ZnAs@SiO2 NPs. (A) Depiction of ZnAs@SiO2 NPs synthesis. (B) TEM image of ZnAs@SiO2 NPs. Scale bar, 50 nm. Insert: the high-magnification TEM image of ZnAs@SiO2 NPs indicating the formation of zinc arsenite nano-complexes (white arrows) in the silica shell. Scale bar, 10 nm. (C) DLS profile of ZnAs@SiO2 NPs. (D) EDX mapping images of the ZnAs@SiO2 NPs. Scale bar, 1 µm. (E) EDS of accumulative ZnAs@SiO2 NPs in the copper mesh. (F) Zn and As ions release from HSS at different pH values of 7.4 (with or without 10% FBS) and 6.4 (n = 3).

