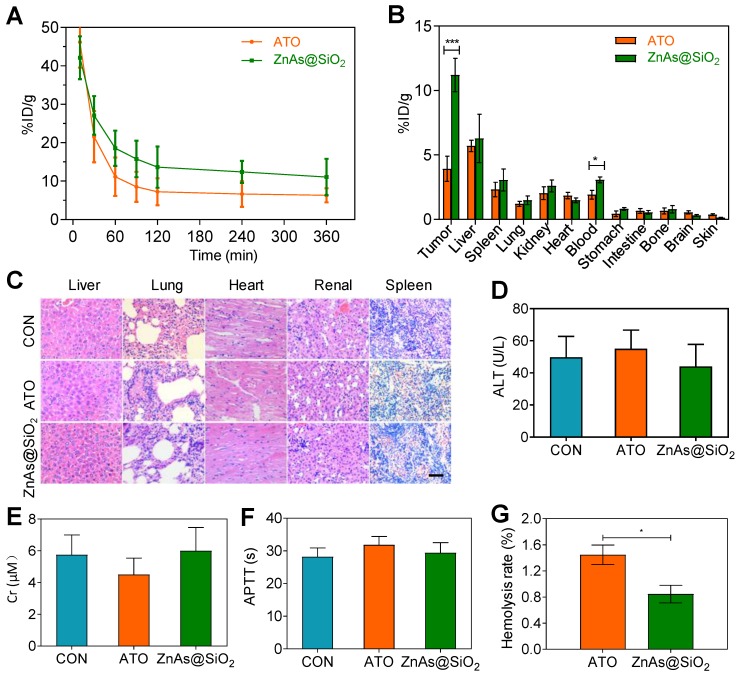
Figure 7.
Pharmacokinetics, bio-distribution, and blood compatibility in vivo. (A) Circulation curves of ATO and ZnAs@SiO2 NPs in mice by the measurement of As ions. Concentration of As was determined by ICP-MS. (n = 3) (B) Bio-distribution of As ions in mice at 24 h after intravenous injection of ATO and ZnAs@SiO2 NPs (n = 3). (C) HE-stained images of tissue sections from main organs: liver, lung, heart, kidney, and spleen of the mice after injections of PBS, ATO, or ZnAs@SiO2 NPs for 6 times in 21 days. Scale bar, 50 µm. (D-F) Blood analysis of ALT (D), Cr (E), APTT (F) after injections of PBS, ATO, or ZnAs@SiO2 NPs for 6 times in 21 days. (G) Hemolysis rate of ATO and ZnAs@SiO2 NPs. *, P < 0.05; ***, P < 0.001.

