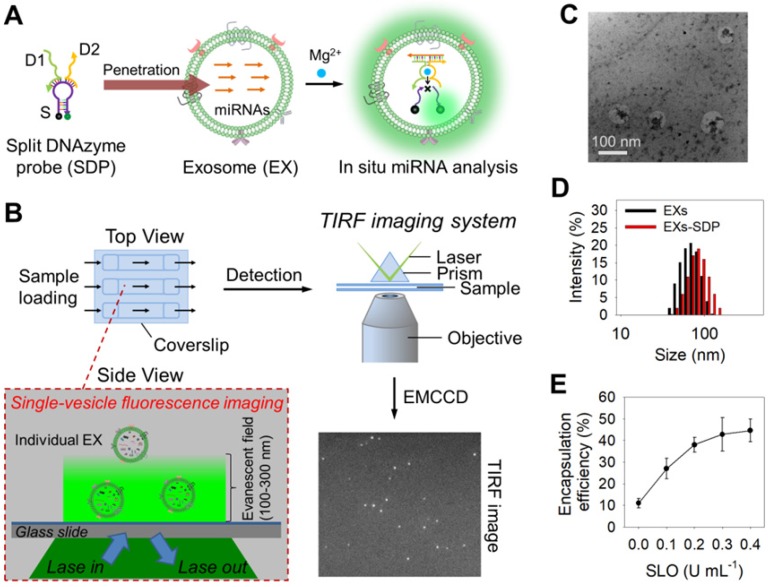
Figure 1.
Schematic overview depicting the TIRF imaging assay of the miRNA contents of EXs and the characterization of isolated A375 EXs. (A) Illustration of the in situ analysis of exosomal miRNAs by using the SDP. (B) Schematic illustration of the single-vesicle fluorescence imaging with TIRF microscopy. In the TIRF image, the fluorescence signal from a single EX was visualized as an individual bright spot. (C) TEM image of isolated A375 EXs. (D) Hydrodynamic diameters of A375 EXs before and after SDP penetration detected by DLS. (E) SLO-mediated penetration of fluorescent DNA probes into A375 EXs.

