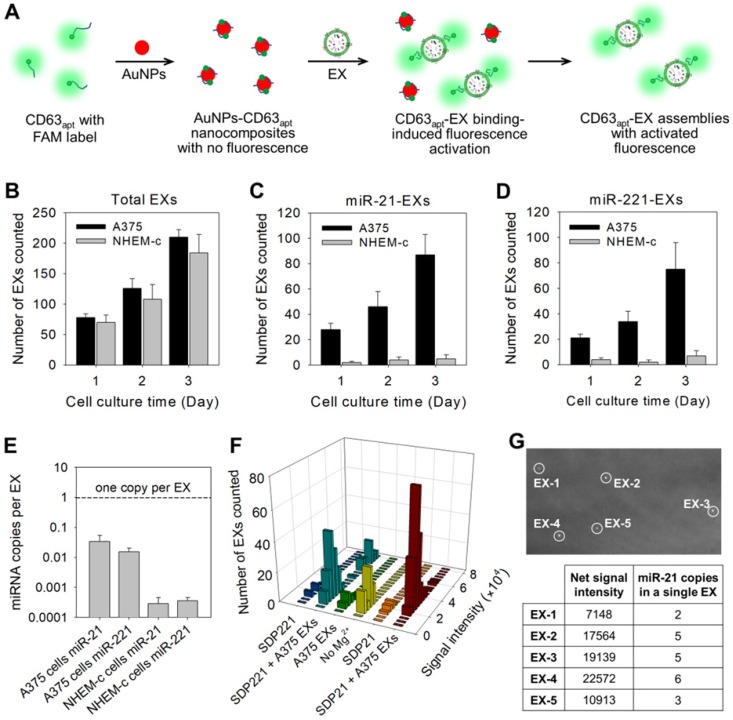
Figure 3.
Stoichiometric analysis of exosomal miRNAs by TIRF imaging assay. (A) Illustration of the fluorescence labeling of total EXs by using CD63 aptamer-based DNA nanoprobes. (B) Total EX signal in A375 and NHEM-c cultures over time. The miR-21-EX (C) and miR-221-EX (D) signals in A375 and NHEM-c cultures over time; n = 3 triplicate samples per time point. (E) Target miRNAs in EXs are present at much less than one copy per EX. (F) Fluorescence intensity analysis of every individual bright spot under different conditions. (G) Analysis of miRNA numbers in a single A375 EX: TIRF image of A375 EXs incubated with MB21 (top), and the calculated miR-21 numbers of each observed A375 EXs (bottom).

