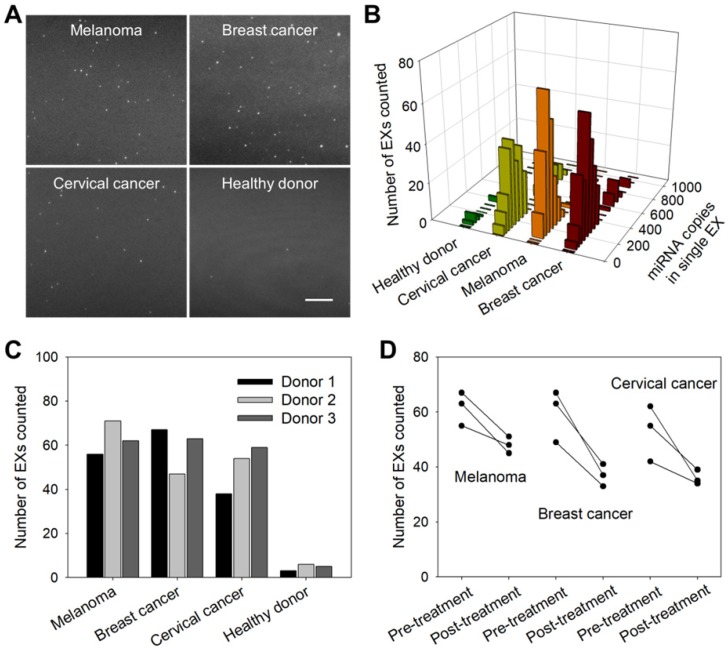
Figure 6.
miR-21-EX imaging analysis and clinical performance. (A) TIRF images of miR-21-EXs in clinical serum samples from cancer patients and healthy donors. Scale bar = 3 µm. (B) Fluorescence intensity analysis of miR-21-EXs at the single-vesicle level in various clinical serum samples. (C) Average number of miR-21-EXs counted in TIRF images of serum samples from cancer patients. (D) Changes in the miR-21-EX levels in serum samples from different cancer patients (n = 3) before and after clinical treatment.

