Figure 4.
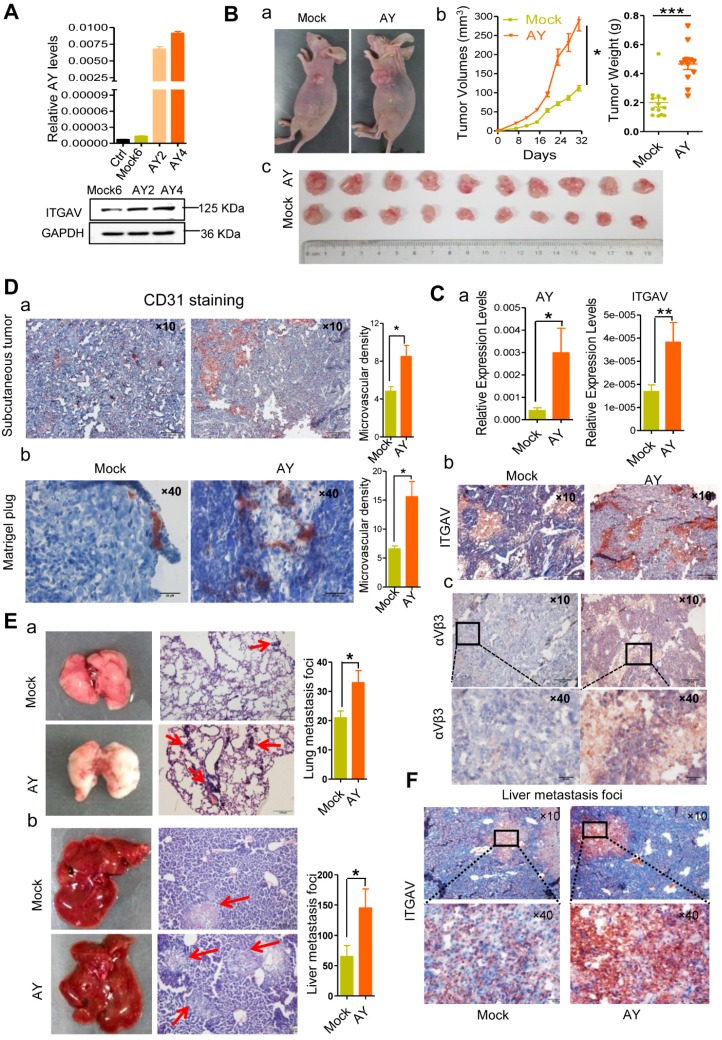
AY promoted HCC cell growth and metastasis. A. Validation of AY and ITGAV expression in stably transfected cell lines by qRT-PCR (upper) and Western blotting (lower), respectively. B. Representative images of nude mice and subcutaneous tumors (a & c). Volume and weight measurements of subcutaneous tumors derived from SMMC-7721 cells stably transfected with pcDNA3.1b (Mock6) and pcDNA3.1b-AY (AY4) (b). C. The AY and ITGAV expression in the implanted tumors were analyzed by qPCR (a). Representative micrographs of immunohistochemical staining with ITGAV and integrin αVβ3 antibodies in the implanted subcutaneous tumors (b & c, bar = 100 μm). The boxed field was amplified in the lower panel (bar = 20 μm). D. Representative images of immunohistochemical staining of CD31 in the subcutaneous tumor (a, bar=100 μm) and the Matrigel-plug (b, bar = 20 μm). Quantitative analysis of the microvascular density in AY-overexpressing cells (right). E. Representative images of lungs and livers (left) from nude mice at 4 weeks after tail vein injections with stably transfected Mock6 and AY4 cells. Images of H&E-staining (middle) and quantitative analysis of metastasis foci (right). Bar = 100 μm. F. Representative images of immunohistochemical ITGAV staining in liver metastatic foci (original magnification: 10×, bar = 100 μm). Boxed fields are shown at 40× magnification (bottom, bar = 20 μm). Data are representative of three independent experiments. *, P < 0.05; **, P < 0.01.

