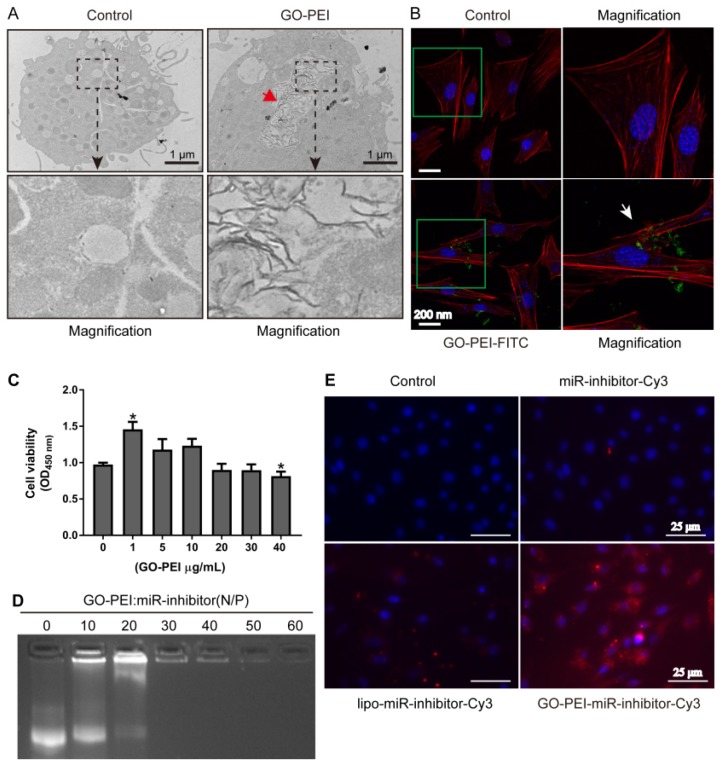
Figure 3.
Evaluation of GO-PEI complex biocompatibility and delivery effectiveness. (A) TEM images of non-GO-PEI cells (named as control) and GO-PEI-induced cells (the concentration of GO-PEI in the culture medium was 3 μg/mL). The images below each group were the enlarged images of the black squares. The red arrowhead indicates GO-PEI inside the cells. Scale bars: 1 μm. (B) Fluorescent images of FITC-labeled GO-PEI (green) within MC3T3-E1 cells are shown. The cell cytoskeleton was stained with phalloidin (red), and the nuclei were stained with DAPI (blue). The FITC-labeled GO-PEI inside the cells was indicated by the white arrowhead. Scale bars: 200 nm. The images on the right of each group are the enlarged images of green squares. (C) The viability of MC3T3-E1 cells was measured by the CCK-8 assay after incubation with various concentrations of GO-PEI for 48 h. *p < 0.05. (D) A gel retardation assay of the mixture of GO-PEI and miRNA at different N/P ratios (0, 10, 20, 30, 40, 50 and 60). (E) Fluorescent images for GO-PEI complex delivery of Cy3-labeled miR-214 inhibitor after 24 h of incubation. miR-214 was labeled using Cy3 (orange red), and the cell nuclei were stained with DAPI (blue).

