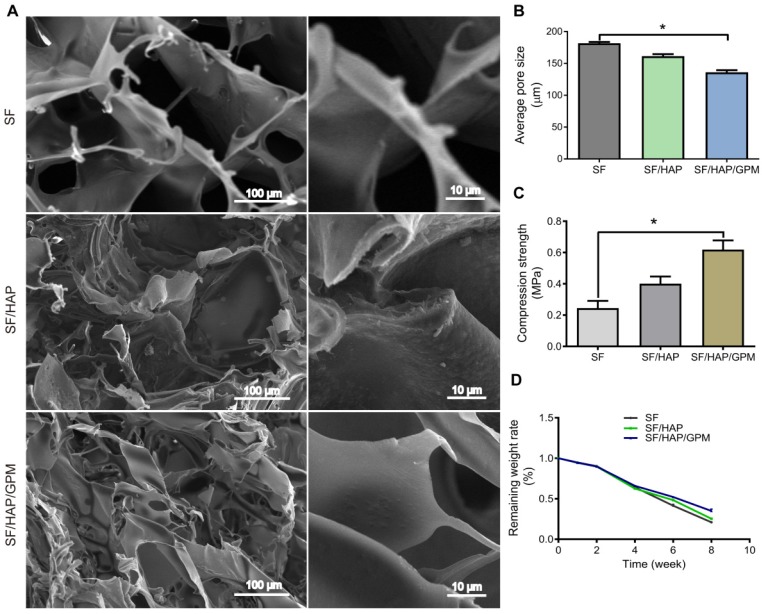
Figure 5.
Characterization and degradation of SF/HAP/GO-PEI-miR scaffolds. (A) SEM images of SF, SF/HAP, and SF/HAP/GPM scaffolds were shown, and the images on the right of each group are enlarged images. Scale bars: 100 μm and 10 μm. (B) Compression strength of the SF, SF/HAP and SF/HAP/GPM scaffolds. n = 4; *p < 0.05. (C) Degradation ratio of SF, SF/HAP and SF/HAP/GPM scaffolds changed with immersion time (2, 4, 6, 8 weeks after immersion).

