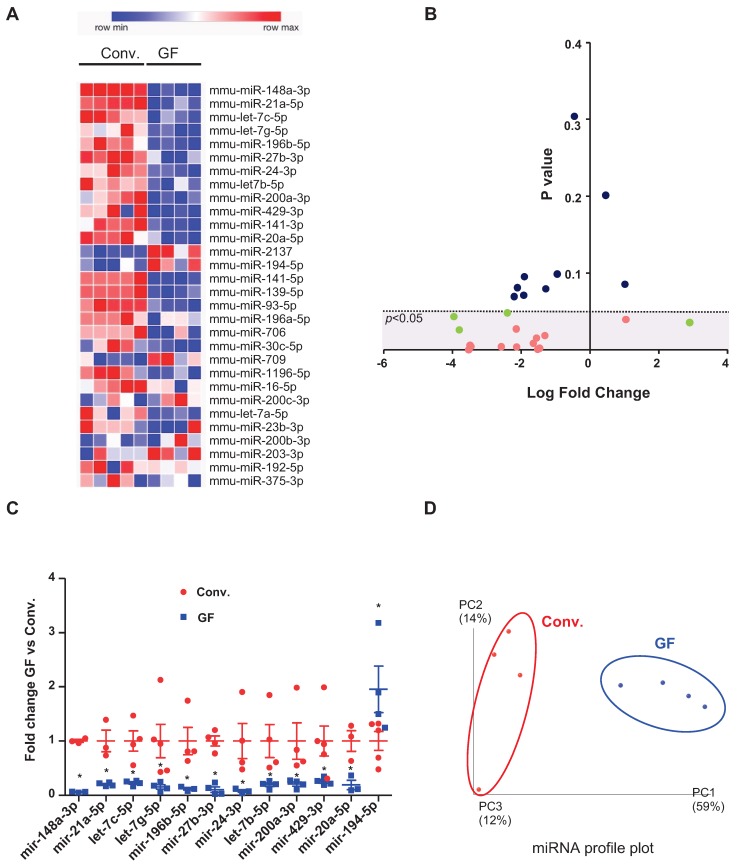
Figure 1.
miRNA profiles in feces of germ-free versus conventionalized mice. Three-weeks old male and female germ-free (GF) mice were either kept sterile or conventionalized (conv.) with a WT microbiota from one donor. Fecal were collected 42 days post-transplantation and fecal miRNA were profiled by high-throughput qPCR-based technology. Heat-map of the 30 most deregulated miRNAs (A). Volcano Plot representing the miRNA fold change versus the p value in the feces of conv. and GF mice. miRNAs with non-significant fold changes (blue) and with significant fold changes but fewer than three values per group (green) were excluded from subsequent analyses, while those that passed the significance cutoff and had more than three values per group were selected for further analyses (pink). Dotted line = limit of significance (p < 0.05) (B). Expression profiles of 12 selected deregulated miRNA in GF mice compared to conv. mice. The average expression of each miRNA in conv. mice was set to 1. *p < 0.05 (C). Conv. or GF mice were clustered using normed principal coordinate analysis (PCoA) of the expression levels of the top 12 deregulated miRNAs (D) (n=4-5).

