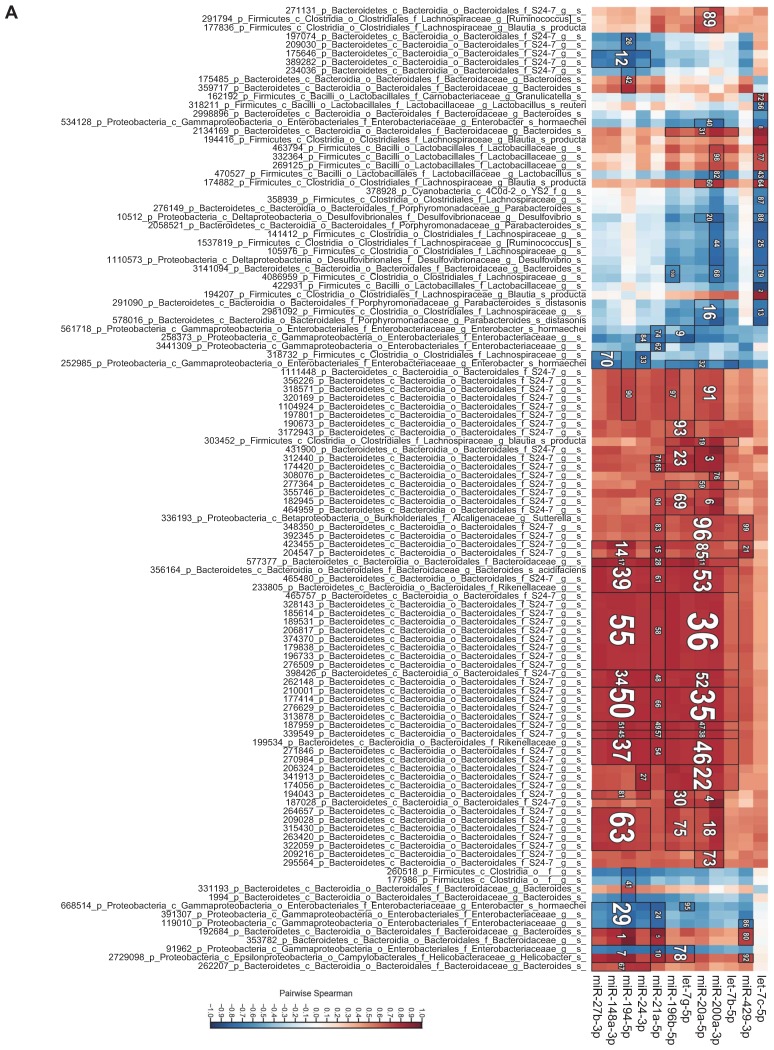
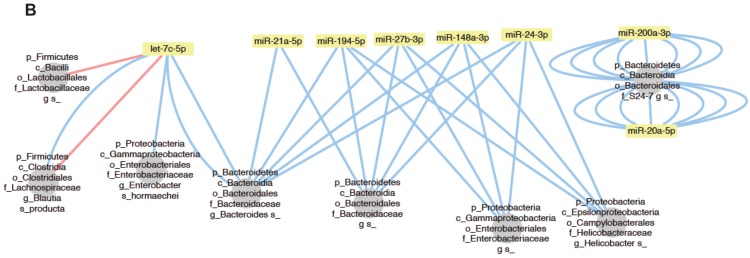
Figure 6.
Bacteria and fecal miRNA expression levels significantly correlate. A, Heat-map showing bacterial taxa (in rows) that were significantly correlated with various miRNAs (in columns). Red and blue indicate positive and negative correlations, respectively. B, Interaction network showing miRNAs and their correlated bacteria (correlation q-value of ≤ 0.02). Red and blue indicate negative and positive correlations, respectively.


