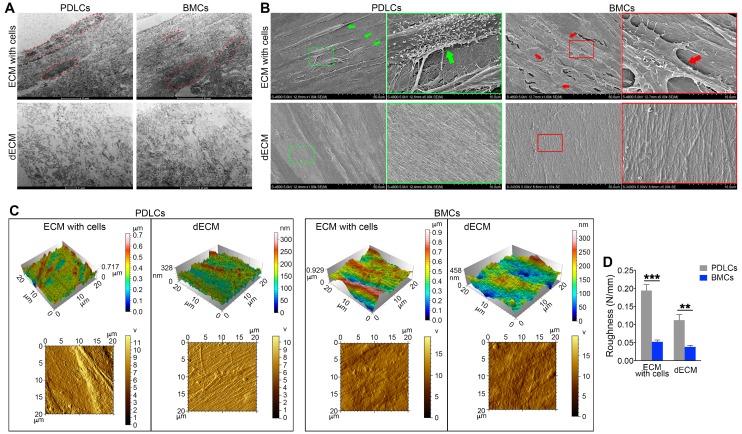
Figure 4.
Electron micrographs of decellularization of B-ECM and P-ECM. (A) TEM analysis of ECMs prepared from the two cell types before and after decellularization. Red dots, the indicated cellular structure. (B) SEM analysis of ECMs prepared from the two cell types before and after decellularization. Green box, high magnification of P-ECM. Green arrow, the indicated PDLC cellular structure. Red box, high magnification of B-ECM. Red arrow, the indicated BMC cellular structure. (C) 3D structure phase and tapping mode amplitude AFM images of B-ECM and P-ECM before and after decellularization. (D) Difference in roughness of B-ECM and P-ECM before and after decellularization. The data are presented as the means ± SD; n = 5. ** P < 0.01 and *** P < 0.001 represent significant differences between the indicated columns.

